bundles / papyri 0.0.10 / examples
Example
simple_plot.py
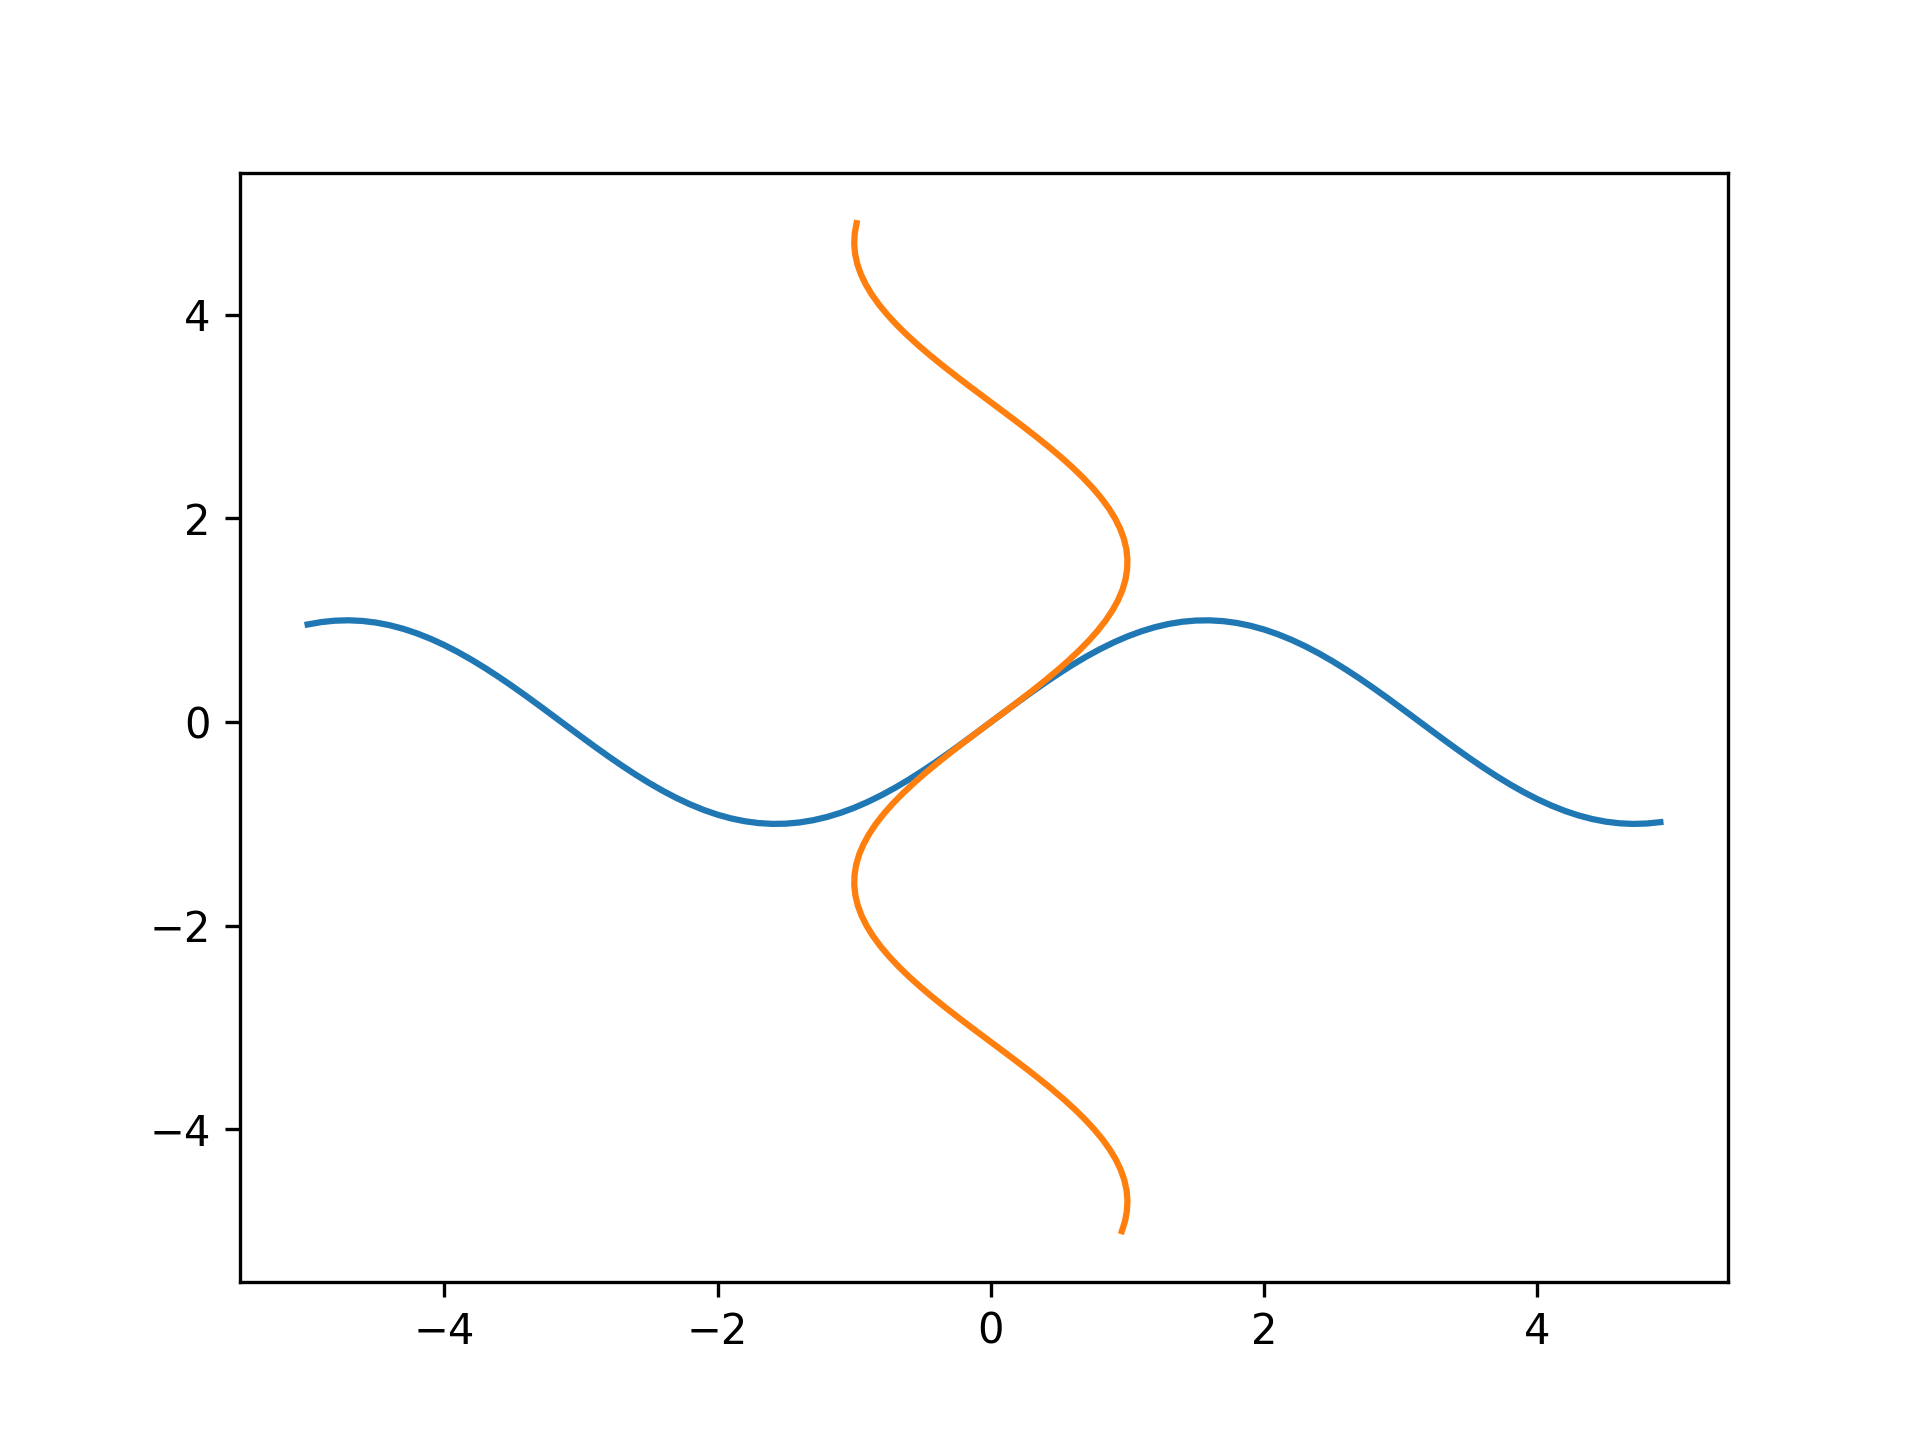
import matplotlib.pyplot as plt
import numpy as np

fig, ax = plt.subplots()

x = np.arange(0, 10, 0.1) - 5
y = np.sin(x)

ax.plot(x, y)
ax.plot(y, x)
?
bundles / papyri 0.0.10 / examples
Example
import matplotlib.pyplot as plt import numpy as np fig, ax = plt.subplots() x = np.arange(0, 10, 0.1) - 5 y = np.sin(x) ax.plot(x, y) ax.plot(y, x)?