bundles / scipy 1.17.1 / scipy / interpolate / _fitpack_py / spalde
function
scipy.interpolate._fitpack_py:spalde
Signature
def spalde ( x , tck ) Summary
Evaluate a B-spline and all its derivatives at one point (or set of points) up to order k (the degree of the spline), being 0 the spline itself.
Parameters
x: array_likeA point or a set of points at which to evaluate the derivatives. Note that
t(k) <= x <= t(n-k+1)must hold for eachx.tck: tupleA tuple (t,c,k) containing the vector of knots, the B-spline coefficients, and the degree of the spline whose derivatives to compute.
Returns
results: {ndarray, list of ndarrays}An array (or a list of arrays) containing all derivatives up to order k inclusive for each point
x, being the first element the spline itself.
Notes
Array API Standard Support
spalde is not in-scope for support of Python Array API Standard compatible backends other than NumPy.
See dev-arrayapi for more information.
Examples
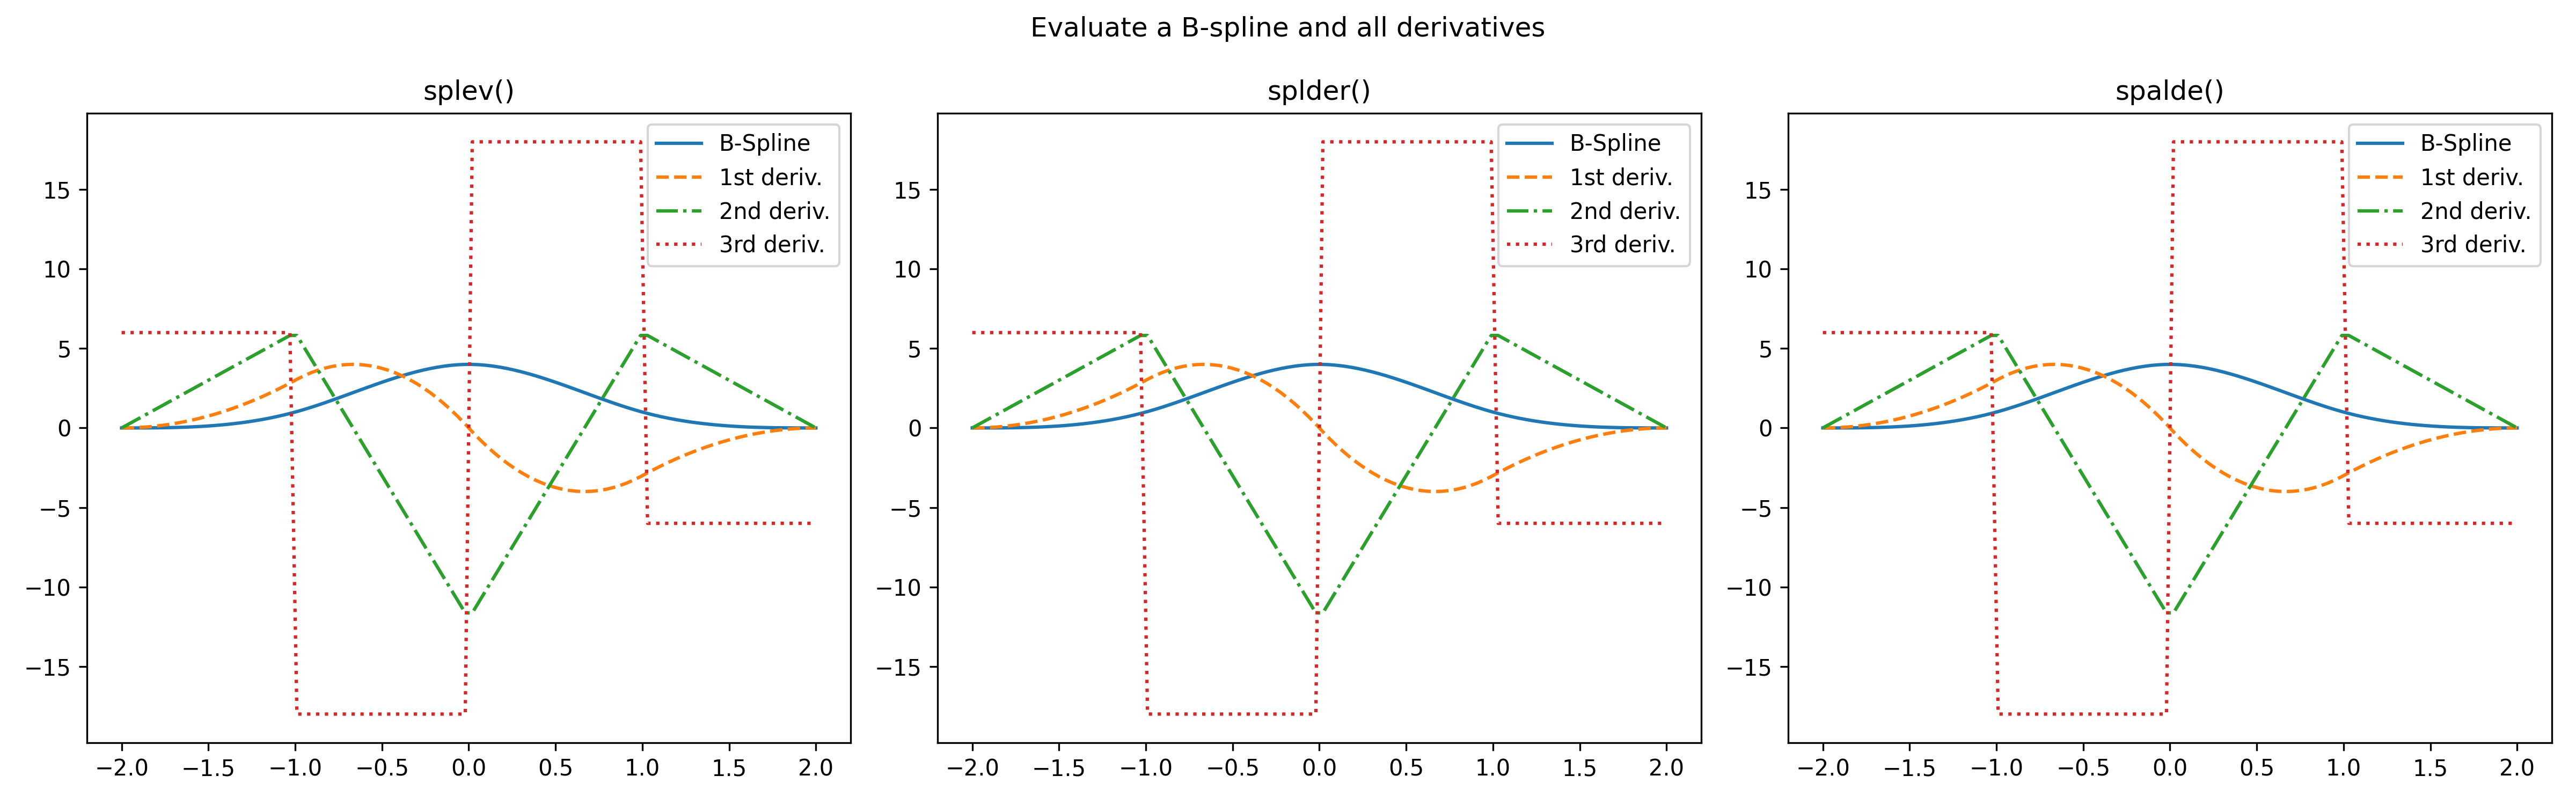
To calculate the derivatives of a B-spline there are several aproaches. In this example, we will demonstrate that `spalde` is equivalent to calling `splev` and `splder`.import numpy as np import matplotlib.pyplot as plt from scipy.interpolate import BSpline, spalde, splder, splev✓
tck = ((-2, -2, -2, -2, -1, 0, 1, 2, 2, 2, 2),  # knots
       (0, 0, 0, 6, 0, 0, 0),  # coefficients
       3)  # degree (cubic)
bspl = BSpline(tck[0], tck[1], tck[2])
x = np.linspace(min(tck[0]), max(tck[0]), 100)
✓
f1_y_bsplin = [spalde(i, tck)[0] for i in x ]  # The B-spline itself
f1_y_deriv1 = [spalde(i, tck)[1] for i in x ]  # 1st derivative
f1_y_deriv2 = [spalde(i, tck)[2] for i in x ]  # 2nd derivative
f1_y_deriv3 = [spalde(i, tck)[3] for i in x ]  # 3rd derivative
f2_y_deriv3 = splev(x, bspl, der=3)
f3_y_deriv3 = splder(bspl, n=3)(x)
✓
fig, (ax1, ax2, ax3) = plt.subplots(1, 3, figsize=(16, 5))
suptitle = fig.suptitle(f'Evaluate a B-spline and all derivatives')
orders = range(4)
linetypes = ['-', '--', '-.', ':']
labels = ['B-Spline', '1st deriv.', '2nd deriv.', '3rd deriv.']
functions = ['splev()', 'splder()', 'spalde()']
✓
for order, linetype, label in zip(orders, linetypes, labels):
    ax1.plot(x, splev(x, bspl, der=order), linetype, label=label)
    ax2.plot(x, splder(bspl, n=order)(x), linetype, label=label)
    ax3.plot(x, [spalde(i, tck)[order] for i in x], linetype, label=label)
for ax, function in zip((ax1, ax2, ax3), functions):
    ax.set_title(function)
    ax.legend()
✗
plt.tight_layout()
plt.show()
✓
See also
- BivariateSpline
- UnivariateSpline
- bisplev
- bisplrep
- splev
- splint
- splprep
- splrep
- sproot
Aliases
-
scipy.interpolate.spalde