bundles / scipy 1.17.1 / scipy / signal / _signaltools / wiener
function
scipy.signal._signaltools:wiener
Signature
def wiener ( im , mysize = None , noise = None ) Summary
Perform a Wiener filter on an N-dimensional array.
Extended Summary
Apply a Wiener filter to the N-dimensional array im.
Parameters
im: ndarrayAn N-dimensional array.
mysize: int or array_like, optionalA scalar or an N-length list giving the size of the Wiener filter window in each dimension. Elements of mysize should be odd. If mysize is a scalar, then this scalar is used as the size in each dimension.
noise: float, optionalThe noise-power to use. If None, then noise is estimated as the average of the local variance of the input.
Returns
out: ndarrayWiener filtered result with the same shape as
im.
Notes
This implementation is similar to wiener2 in Matlab/Octave. For more details see [1]
Array API Standard Support
wiener has experimental support for Python Array API Standard compatible backends in addition to NumPy. Please consider testing these features by setting an environment variable SCIPY_ARRAY_API=1 and providing CuPy, PyTorch, JAX, or Dask arrays as array arguments. The following combinations of backend and device (or other capability) are supported.
====================  ====================  ====================
Library               CPU                   GPU
====================  ====================  ====================
NumPy                 ✅                     n/a
CuPy                  n/a                   ✅
PyTorch               ✅                     ⛔
JAX                   ⚠️ no JIT             ⚠️ no JIT
Dask                  ⚠️ computes graph     n/a
====================  ====================  ====================
See
dev-arrayapifor more information.
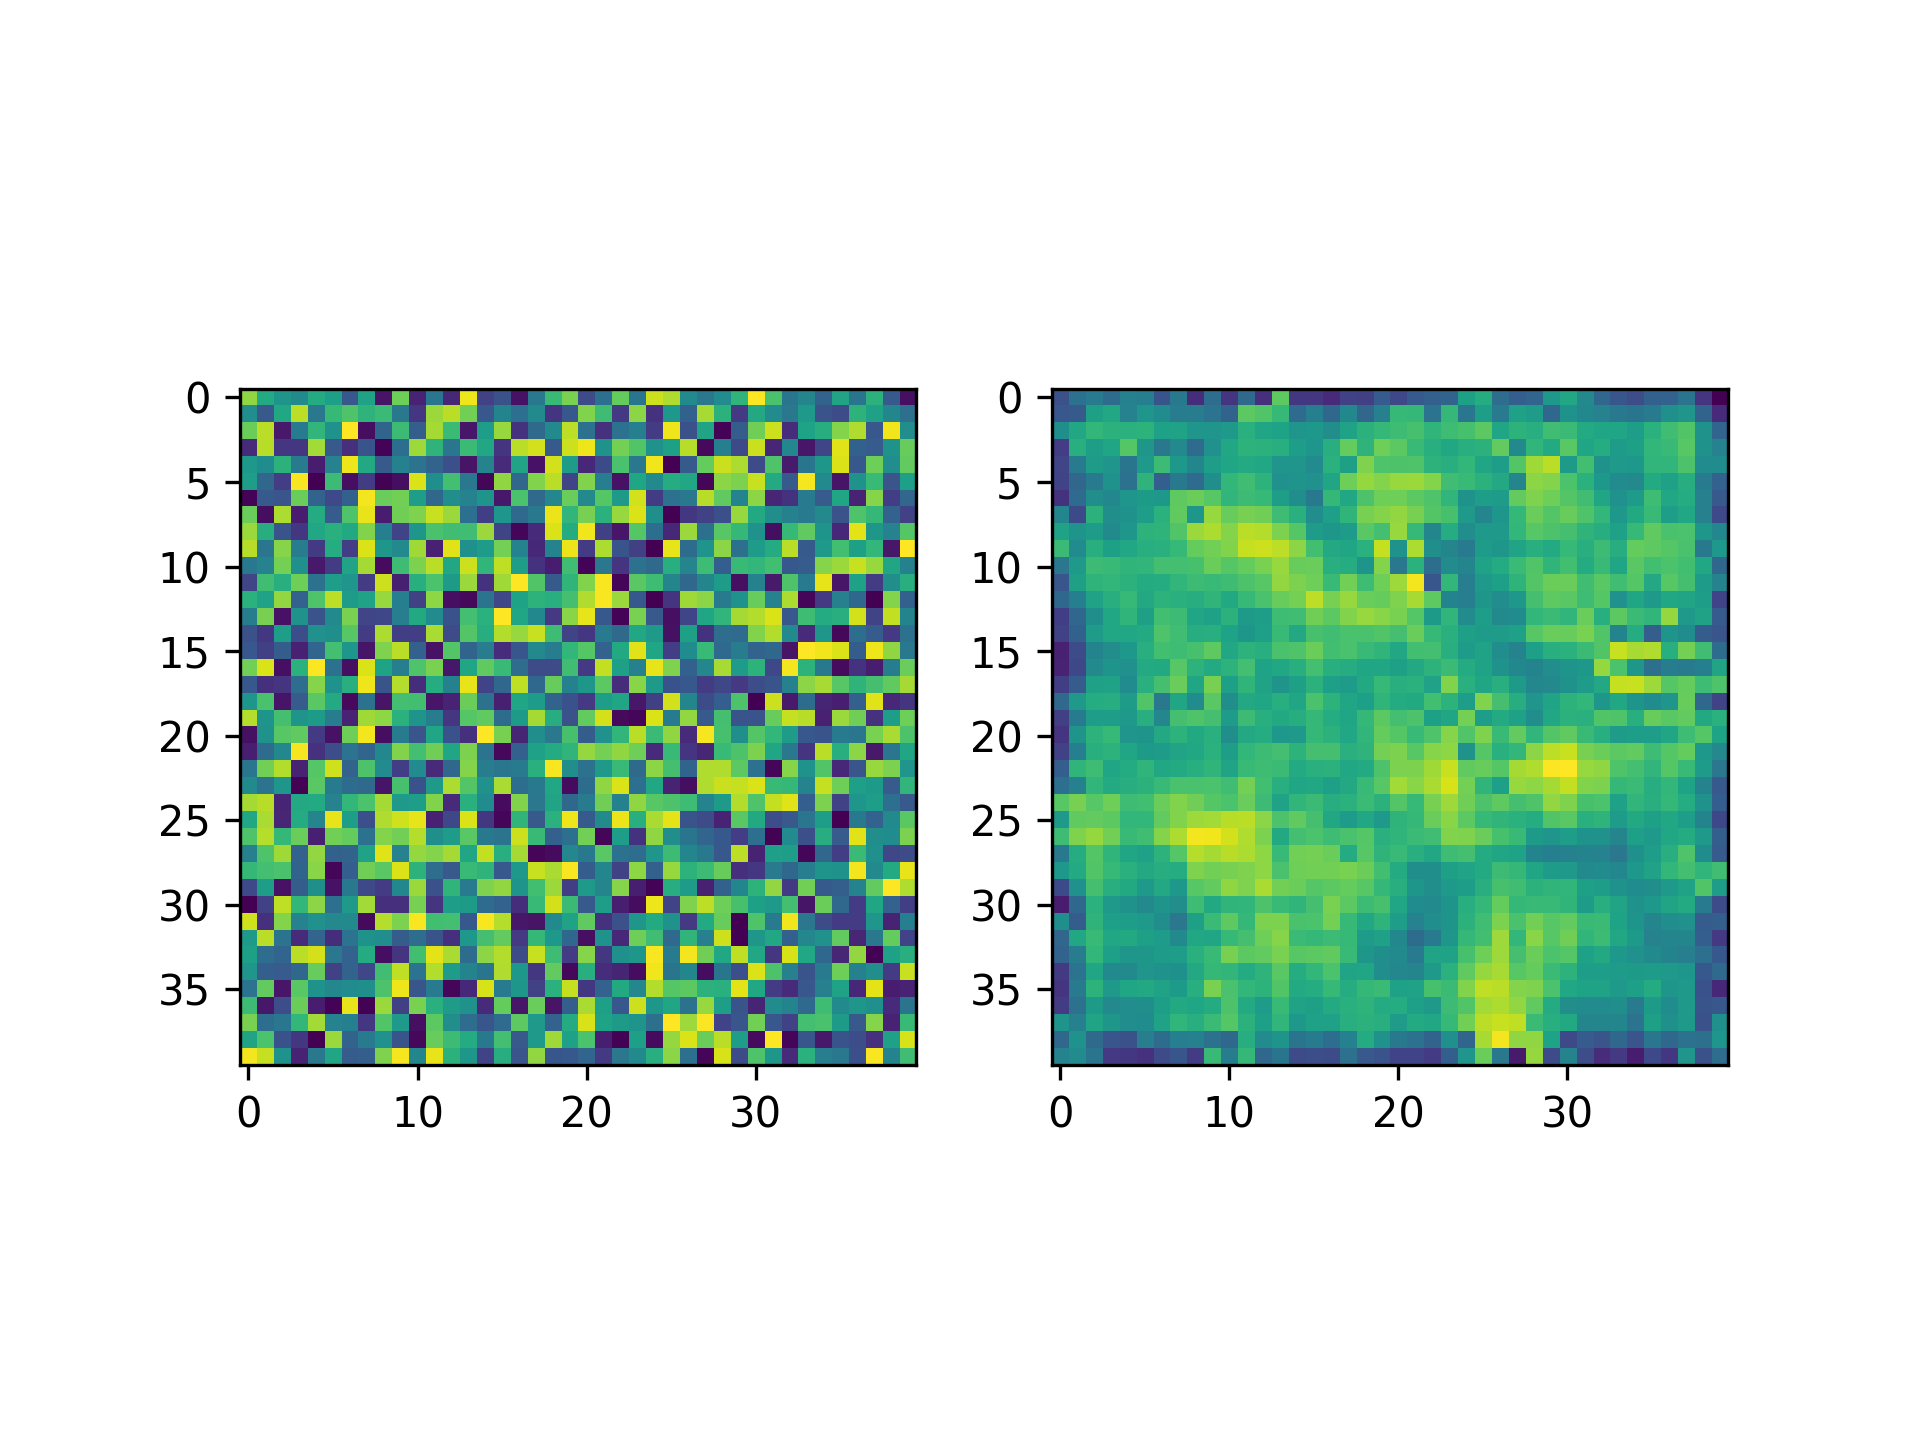
Examples
from scipy.datasets import face
from scipy.signal import wiener
import matplotlib.pyplot as plt
import numpy as np
rng = np.random.default_rng()
img = rng.random((40, 40))    #Create a random image
filtered_img = wiener(img, (5, 5))  #Filter the image
f, (plot1, plot2) = plt.subplots(1, 2)
✓
plot1.imshow(img)
plot2.imshow(filtered_img)
✗
plt.show()
✓
Aliases
-
scipy.signal.wiener