bundles / scipy 1.17.1 / scipy / special / _basic / y1p_zeros
function
scipy.special._basic:y1p_zeros
source: /scipy/special/_basic.py :730
Signature
def y1p_zeros ( nt , complex = False ) Summary
Compute nt zeros of Bessel derivative Y1'(z), and value at each zero.
Extended Summary
The values are given by Y1(z1) at each z1 where Y1'(z1)=0.
Parameters
nt: intNumber of zeros to return
complex: bool, default FalseSet to False to return only the real zeros; set to True to return only the complex zeros with negative real part and positive imaginary part. Note that the complex conjugates of the latter are also zeros of the function, but are not returned by this routine.
Returns
z1pn: ndarrayLocation of nth zero of Y1'(z)
y1z1pn: ndarrayValue of derivative Y1(z1) for nth zero
Examples
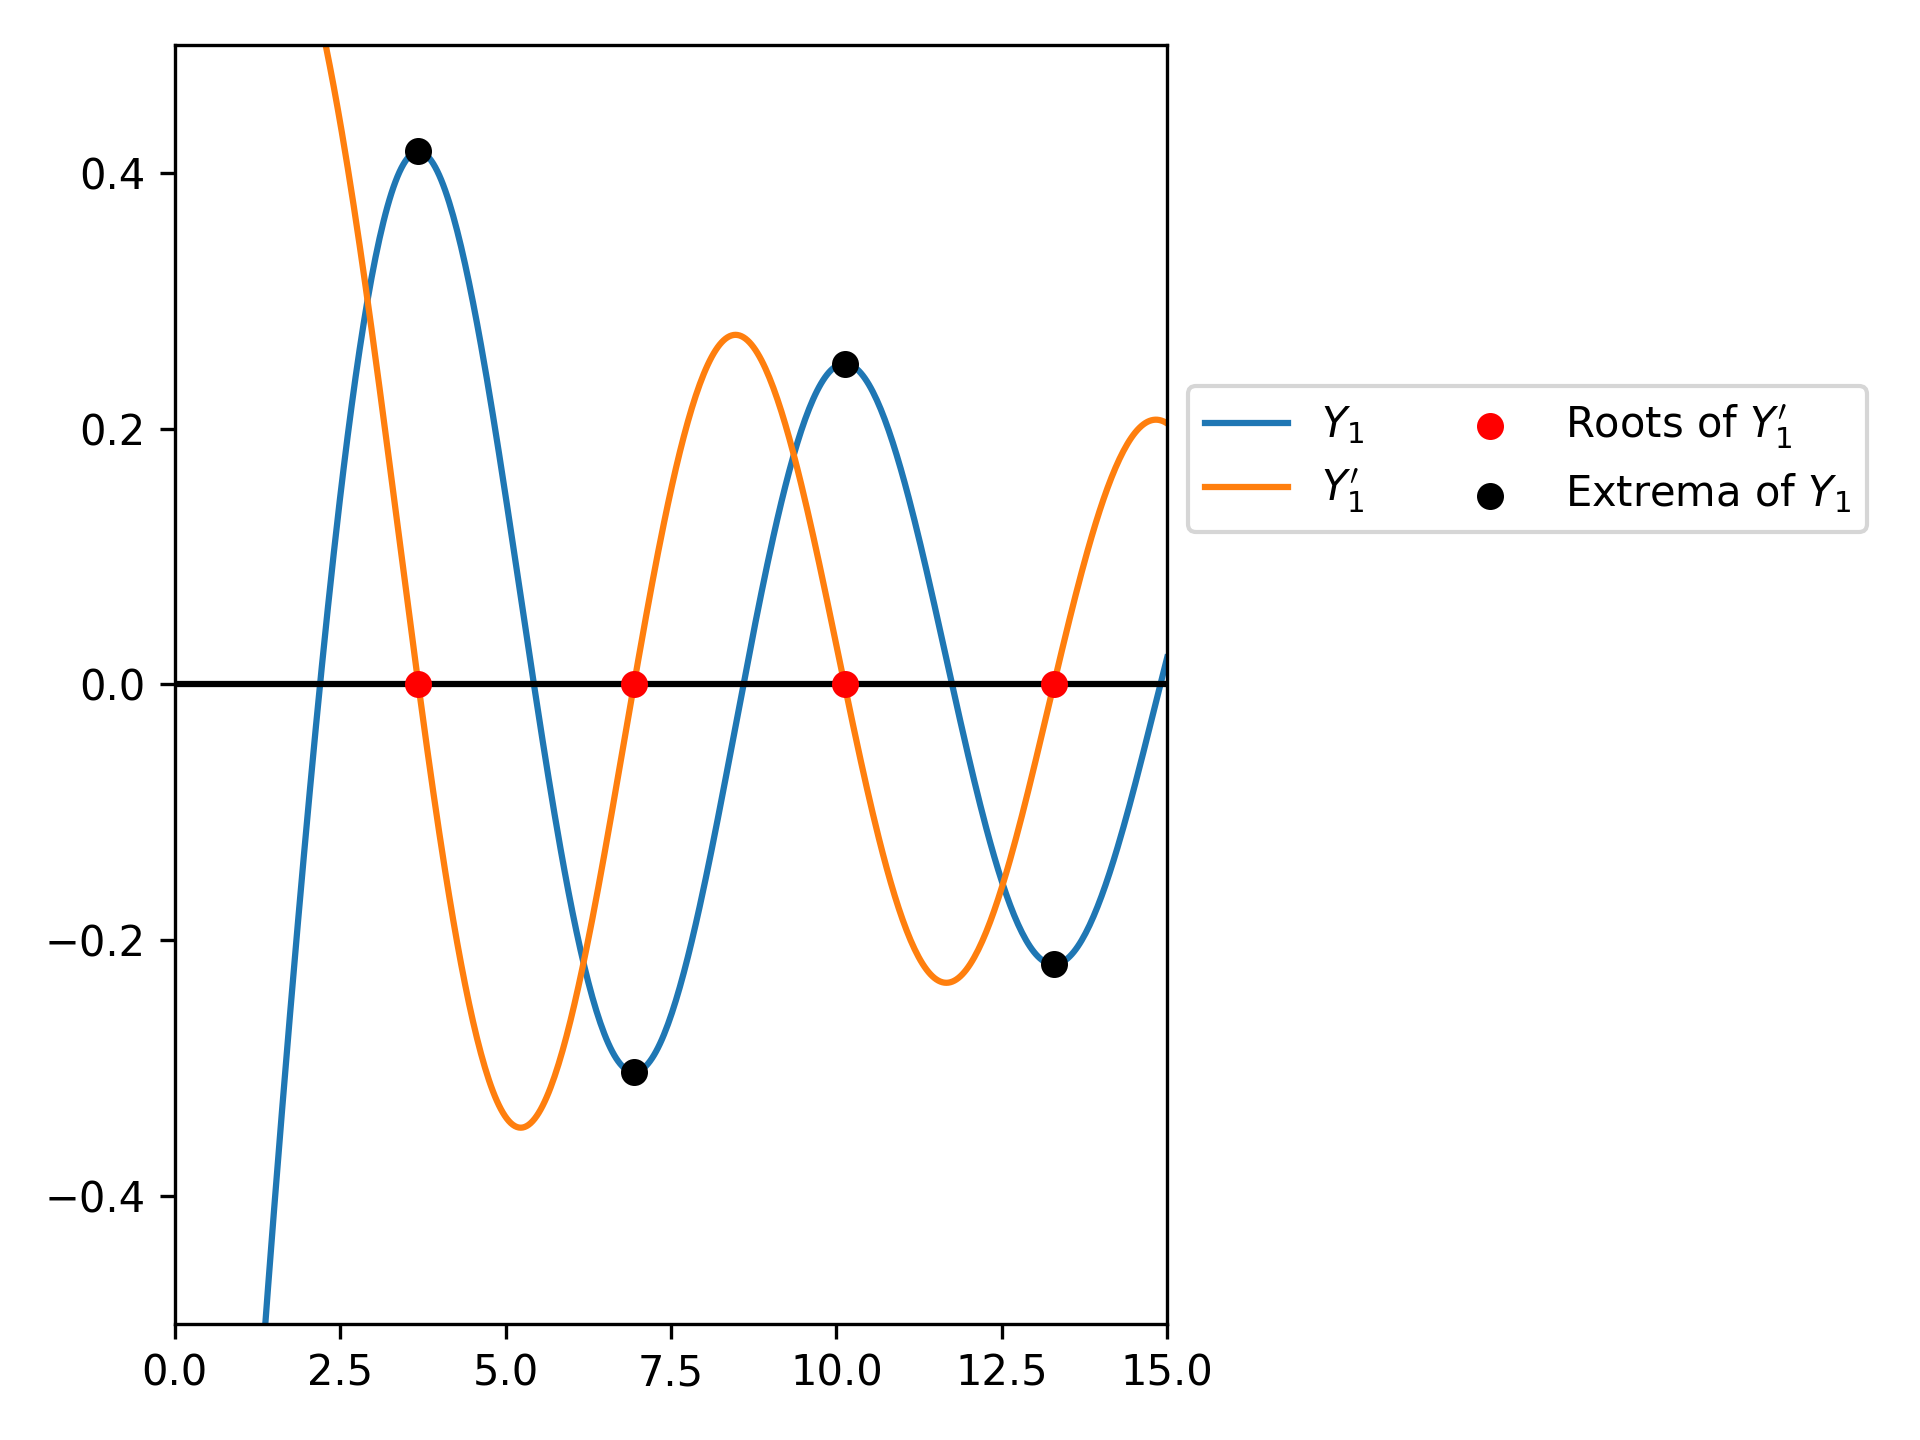
Compute the first four roots of :math:`Y_1'` and the values of :math:`Y_1` at these roots.import numpy as np from scipy.special import y1p_zeros y1grad_roots, y1_values = y1p_zeros(4) with np.printoptions(precision=5): print(f"Y1' Roots: {y1grad_roots.real}") print(f"Y1 values: {y1_values.real}")✓
import matplotlib.pyplot as plt
from scipy.special import y1, yvp
y1_roots, y1_values_at_roots = y1p_zeros(4)
real_roots = y1_roots.real
xmax = 15
x = np.linspace(0, xmax, 500)
x[0] += 1e-15
fig, ax = plt.subplots()
✓
ax.plot(x, y1(x), label=r'$Y_1$')
ax.plot(x, yvp(1, x, 1), label=r"$Y_1'$")
ax.scatter(real_roots, np.zeros((4, )), s=30, c='r',
           label=r"Roots of $Y_1'$", zorder=5)
ax.scatter(real_roots, y1_values_at_roots.real, s=30, c='k',
           label=r"Extrema of $Y_1$", zorder=5)
ax.hlines(0, 0, xmax, color='k')
ax.set_ylim(-0.5, 0.5)
ax.set_xlim(0, xmax)
ax.legend(ncol=2, bbox_to_anchor=(1., 0.75))
✗
plt.tight_layout()
plt.show()
✓
Aliases
-
scipy.special.y1p_zeros