bundles / scipy 1.17.1 / scipy / stats / _binned_statistic / binned_statistic
function
scipy.stats._binned_statistic:binned_statistic
Signature
def binned_statistic ( x , values , statistic = mean , bins = 10 , range = None ) Summary
Compute a binned statistic for one or more sets of data.
Extended Summary
This is a generalization of a histogram function. A histogram divides the space into bins, and returns the count of the number of points in each bin. This function allows the computation of the sum, mean, median, or other statistic of the values (or set of values) within each bin.
Parameters
x: (N,) array_likeA sequence of values to be binned.
values: (N,) array_like or list of (N,) array_likeThe data on which the statistic will be computed. This must be the same shape as
x, or a set of sequences - each the same shape asx. Ifvaluesis a set of sequences, the statistic will be computed on each independently.statistic: string or callable, optionalThe statistic to compute (default is 'mean'). The following statistics are available:
'mean'compute the mean of values for points within each bin. Empty bins will be represented by NaN.
'std'compute the standard deviation within each bin. This is implicitly calculated with ddof=0.
'median'compute the median of values for points within each bin. Empty bins will be represented by NaN.
'count'compute the count of points within each bin. This is identical to an unweighted histogram.
valuesarray is not referenced.'sum'compute the sum of values for points within each bin. This is identical to a weighted histogram.
'min'compute the minimum of values for points within each bin. Empty bins will be represented by NaN.
'max'compute the maximum of values for point within each bin. Empty bins will be represented by NaN.
functiona user-defined function which takes a 1D array of values, and outputs a single numerical statistic. This function will be called on the values in each bin. Empty bins will be represented by function([]), or NaN if this returns an error.
bins: int or sequence of scalars, optionalIf
binsis an int, it defines the number of equal-width bins in the given range (10 by default). Ifbinsis a sequence, it defines the bin edges, including the rightmost edge, allowing for non-uniform bin widths. Values inxthat are smaller than lowest bin edge are assigned to bin number 0, values beyond the highest bin are assigned tobins[-1]. If the bin edges are specified, the number of bins will be, (nx = len(bins)-1).range: (float, float) or [(float, float)], optionalThe lower and upper range of the bins. If not provided, range is simply
(x.min(), x.max()). Values outside the range are ignored.
Returns
statistic: arrayThe values of the selected statistic in each bin.
bin_edges: array of dtype floatReturn the bin edges
(length(statistic)+1).: binnumber: 1-D ndarray of intsIndices of the bins (corresponding to bin_edges) in which each value of
xbelongs. Same length asvalues. A binnumber ofimeans the corresponding value is between (bin_edges[i-1], bin_edges[i]).
Notes
All but the last (righthand-most) bin is half-open. In other words, if bins is [1, 2, 3, 4], then the first bin is [1, 2) (including 1, but excluding 2) and the second [2, 3). The last bin, however, is [3, 4], which includes 4.
Array API Standard Support
binned_statistic has experimental support for Python Array API Standard compatible backends in addition to NumPy. Please consider testing these features by setting an environment variable SCIPY_ARRAY_API=1 and providing CuPy, PyTorch, JAX, or Dask arrays as array arguments. The following combinations of backend and device (or other capability) are supported.
====================  ====================  ====================
Library               CPU                   GPU
====================  ====================  ====================
NumPy                 ✅                     n/a
CuPy                  n/a                   ⛔
PyTorch               ⛔                     ⛔
JAX                   ⛔                     ⛔
Dask                  ⛔                     n/a
====================  ====================  ====================
See
dev-arrayapifor more information.
Examples
import numpy as np
from scipy import stats
import matplotlib.pyplot as plt
✓
values = [1.0, 1.0, 2.0, 1.5, 3.0]
✓stats.binned_statistic([1, 1, 2, 5, 7], values, 'sum', bins=2)
✗values = [[1.0, 1.0, 2.0, 1.5, 3.0], [2.0, 2.0, 4.0, 3.0, 6.0]]
✓stats.binned_statistic([1, 1, 2, 5, 7], values, 'sum', bins=2)
✗stats.binned_statistic([1, 2, 1, 2, 4], np.arange(5), statistic='mean', bins=3)✗
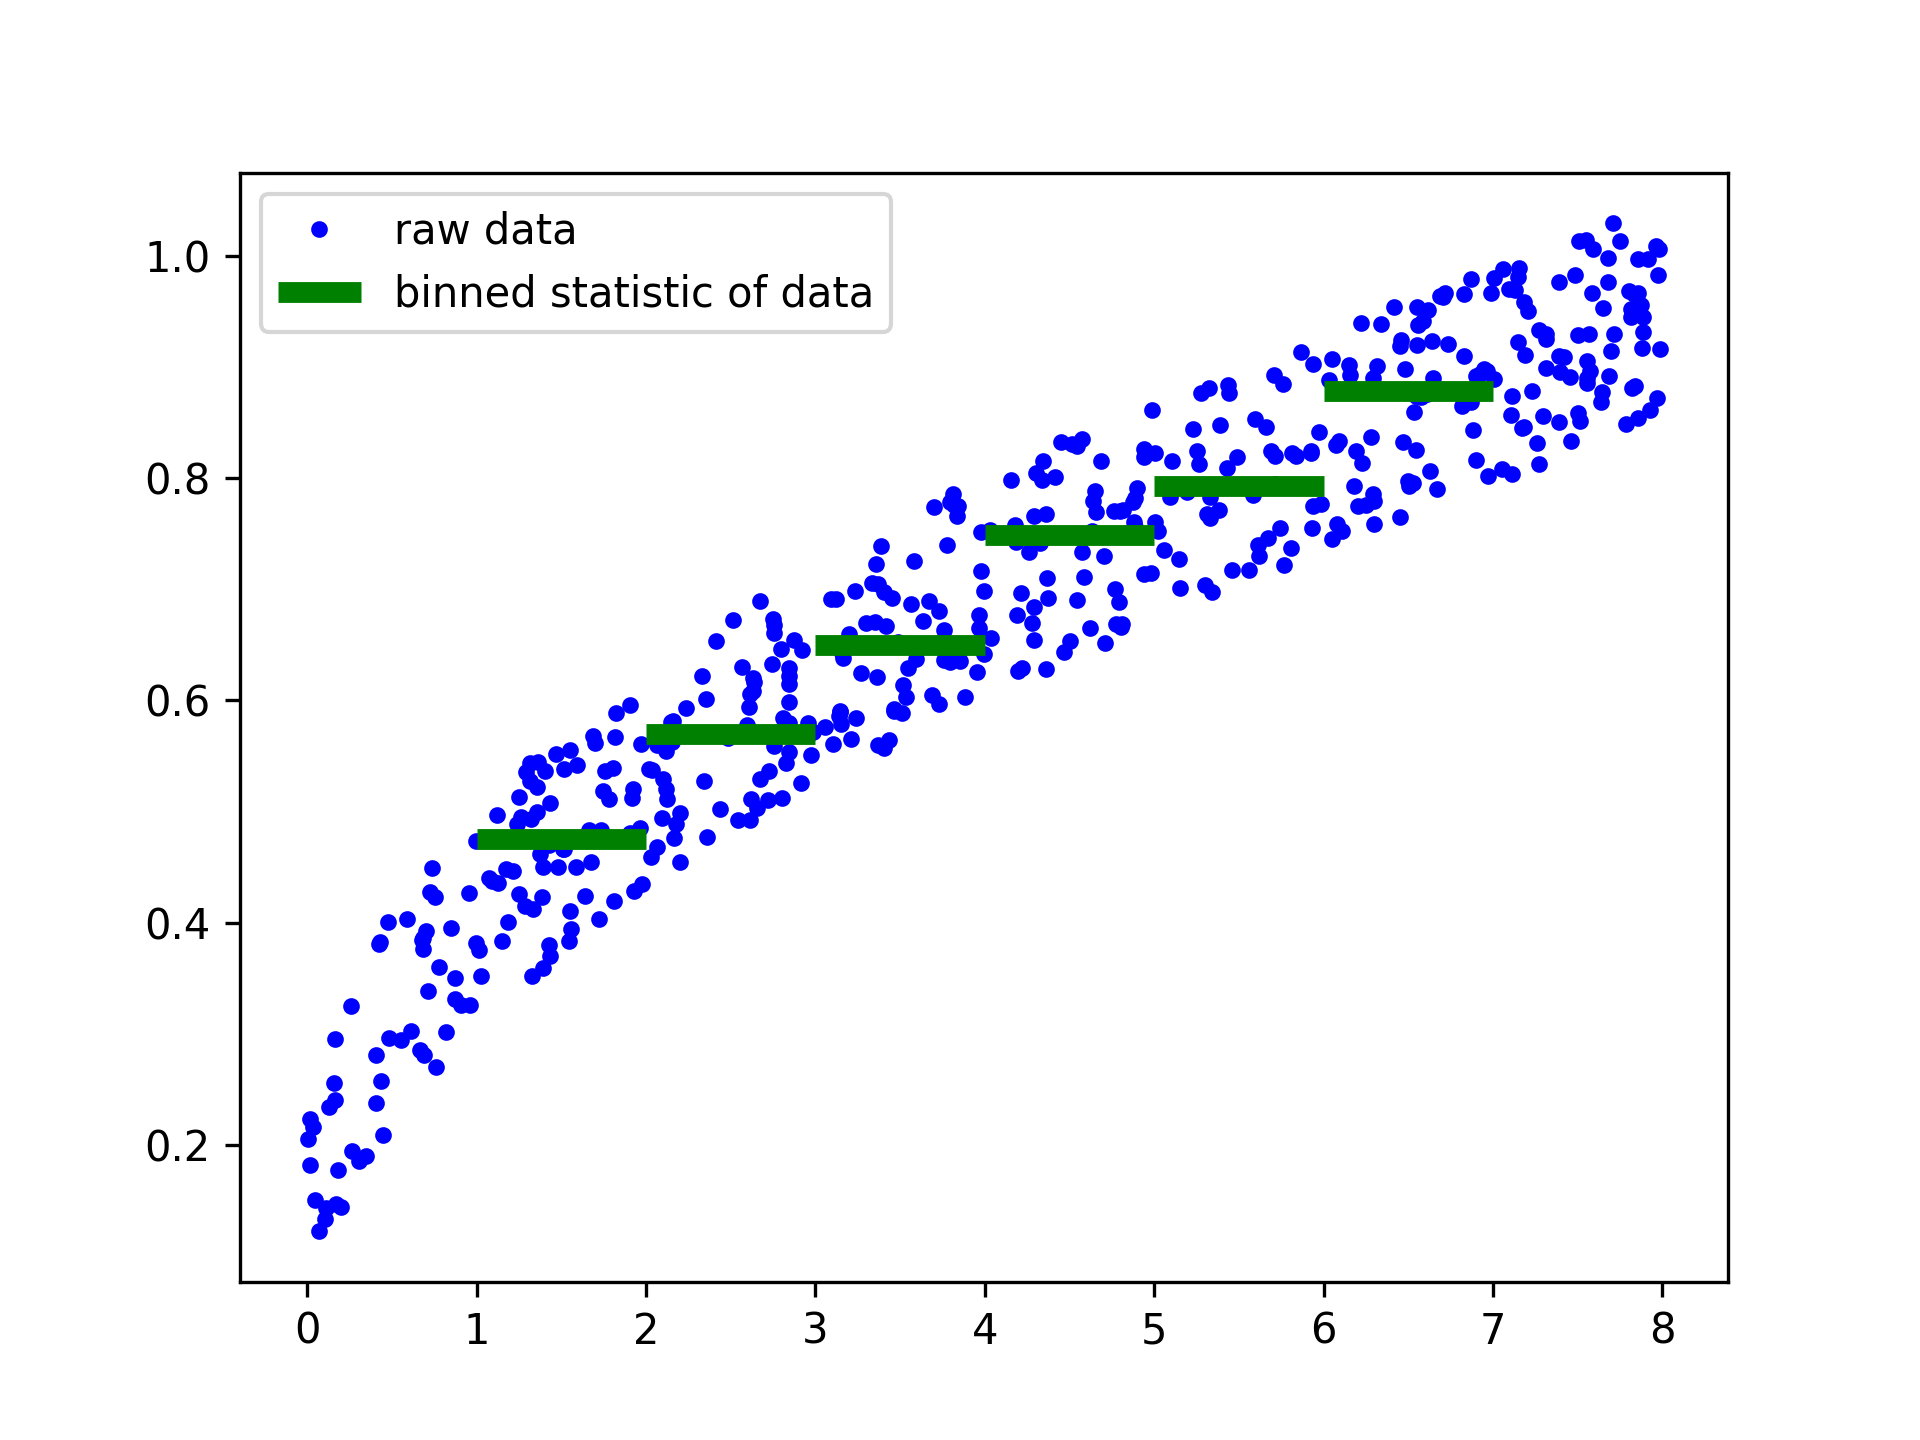
rng = np.random.default_rng()
windspeed = 8 * rng.random(500)
boatspeed = .3 * windspeed**.5 + .2 * rng.random(500)
bin_means, bin_edges, binnumber = stats.binned_statistic(windspeed,
                boatspeed, statistic='median', bins=[1,2,3,4,5,6,7])
✓
plt.figure()
plt.plot(windspeed, boatspeed, 'b.', label='raw data')
plt.hlines(bin_means, bin_edges[:-1], bin_edges[1:], colors='g', lw=5,
           label='binned statistic of data')
plt.legend()
✗
low_boatspeed = boatspeed[binnumber == 0]
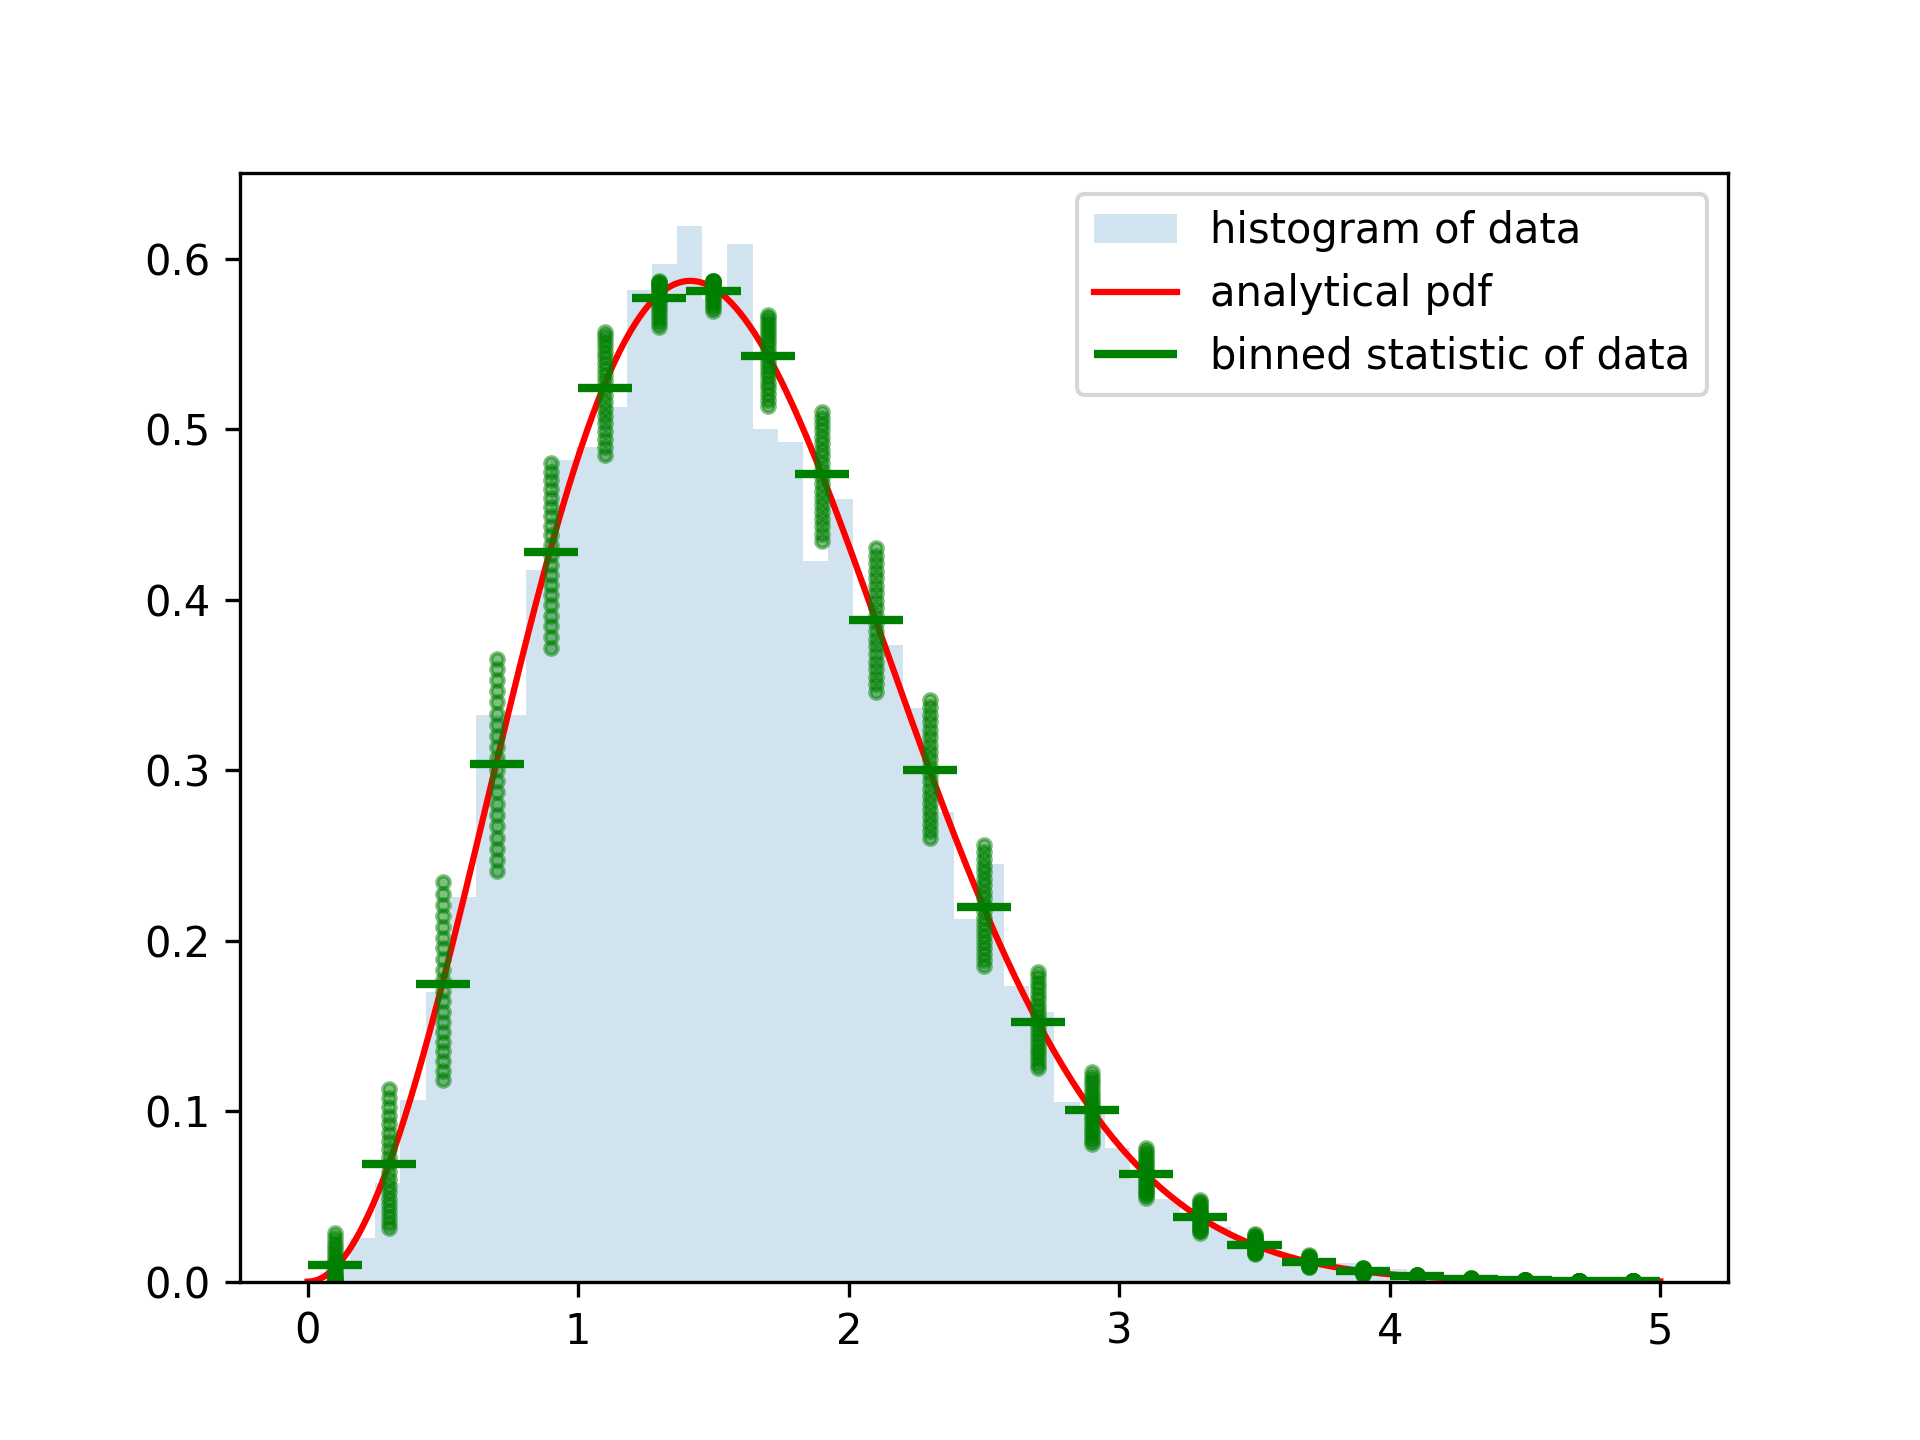
✓x = np.linspace(0, 5, num=500) x_pdf = stats.maxwell.pdf(x) samples = stats.maxwell.rvs(size=10000)✓
bin_means, bin_edges, binnumber = stats.binned_statistic(x, x_pdf,
        statistic='mean', bins=25)
bin_width = (bin_edges[1] - bin_edges[0])
bin_centers = bin_edges[1:] - bin_width/2
✓
plt.figure()
plt.hist(samples, bins=50, density=True, histtype='stepfilled',
         alpha=0.2, label='histogram of data')
plt.plot(x, x_pdf, 'r-', label='analytical pdf')
plt.hlines(bin_means, bin_edges[:-1], bin_edges[1:], colors='g', lw=2,
           label='binned statistic of data')
plt.plot((binnumber - 0.5) * bin_width, x_pdf, 'g.', alpha=0.5)
plt.legend(fontsize=10)
✗
plt.show()
✓
See also
- binned_statistic_2d
- binned_statistic_dd
- numpy.digitize
- numpy.histogram
Aliases
-
scipy.stats.binned_statistic