bundles / scipy 1.17.1 / scipy / stats / _distribution_infrastructure / log
function
scipy.stats._distribution_infrastructure:log
Signature
def log ( X , / ) Summary
Natural logarithm of a non-negative random variable
Parameters
X: `ContinuousDistribution`The random variable with positive support.
Returns
Y: `ContinuousDistribution`A random variable .
Notes
Array API Standard Support
log has experimental support for Python Array API Standard compatible backends in addition to NumPy. Please consider testing these features by setting an environment variable SCIPY_ARRAY_API=1 and providing CuPy, PyTorch, JAX, or Dask arrays as array arguments. The following combinations of backend and device (or other capability) are supported.
====================  ====================  ====================
Library               CPU                   GPU
====================  ====================  ====================
NumPy                 ✅                     n/a
CuPy                  n/a                   ⛔
PyTorch               ⛔                     ⛔
JAX                   ⛔                     ⛔
Dask                  ⛔                     n/a
====================  ====================  ====================
See
dev-arrayapifor more information.
Examples
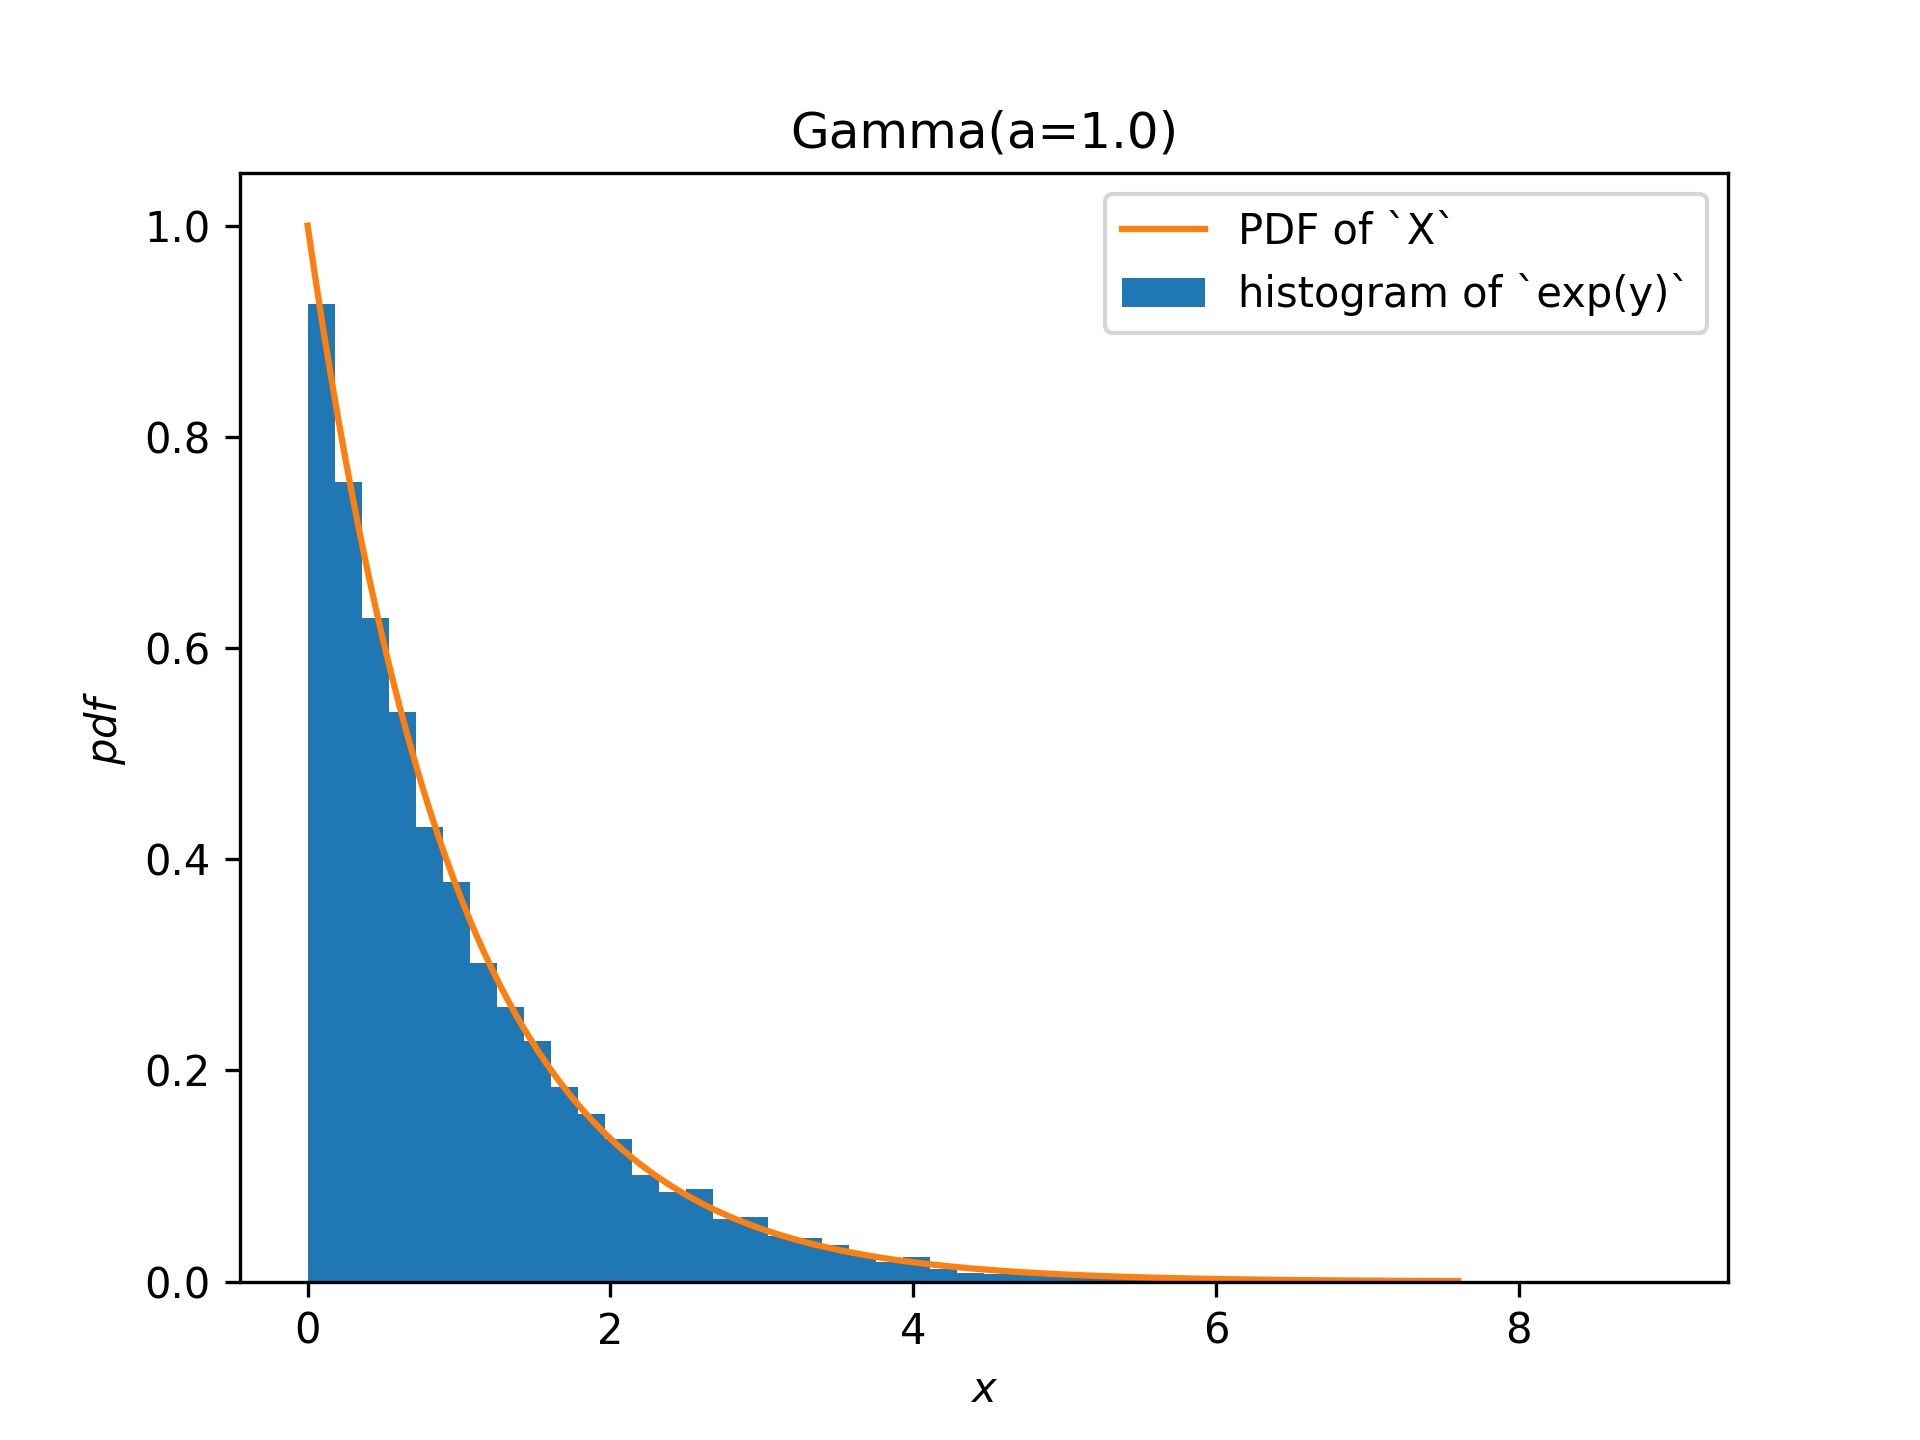
Suppose we have a gamma distributed random variable :math:`X`:import numpy as np from scipy import stats Gamma = stats.make_distribution(stats.gamma) X = Gamma(a=1.0)✓
Y = stats.log(X)
✓import matplotlib.pyplot as plt rng = np.random.default_rng(435383595582522) y = Y.sample(shape=10000, rng=rng) ax = plt.gca()✓
ax.hist(np.exp(y), bins=50, density=True)
X.plot(ax=ax)
plt.legend(('PDF of `X`', 'histogram of `exp(y)`'))
✗
plt.show()
✓
Aliases
-
scipy.stats.log