bundles / scipy 1.17.1 / scipy / stats / _resampling / permutation_test
function
scipy.stats._resampling:permutation_test
Signature
def permutation_test ( data , statistic , * , permutation_type = independent , vectorized = None , n_resamples = 9999 , batch = None , alternative = two-sided , axis = 0 , rng = None , random_state = None ) Summary
Performs a permutation test of a given statistic on provided data.
Extended Summary
For independent sample statistics, the null hypothesis is that the data are randomly sampled from the same distribution. For paired sample statistics, two null hypothesis can be tested: that the data are paired at random or that the data are assigned to samples at random.
Parameters
data: iterable of array-likeContains the samples, each of which is an array of observations. Dimensions of sample arrays must be compatible for broadcasting except along
axis.statistic: callableStatistic for which the p-value of the hypothesis test is to be calculated.
statisticmust be a callable that accepts samples as separate arguments (e.g.statistic(*data)) and returns the resulting statistic. Ifvectorizedis setTrue,statisticmust also accept a keyword argumentaxisand be vectorized to compute the statistic along the providedaxisof the sample arrays.permutation_type: {'independent', 'samples', 'pairings'}, optionalThe type of permutations to be performed, in accordance with the null hypothesis. The first two permutation types are for paired sample statistics, in which all samples contain the same number of observations and observations with corresponding indices along
axisare considered to be paired; the third is for independent sample statistics.'samples'observations are assigned to different samples but remain paired with the same observations from other samples. This permutation type is appropriate for paired sample hypothesis tests such as the Wilcoxon signed-rank test and the paired t-test.'pairings'observations are paired with different observations, but they remain within the same sample. This permutation type is appropriate for association/correlation tests with statistics such as Spearman's , Kendall's , and Pearson's .'independent'(default)observations are assigned to different samples. Samples may contain different numbers of observations. This permutation type is appropriate for independent sample hypothesis tests such as the Mann-Whitney test and the independent sample t-test.Please see the Notes section below for more detailed descriptions of the permutation types.
vectorized: bool, optionalIf
vectorizedis setFalse,statisticwill not be passed keyword argumentaxisand is expected to calculate the statistic only for 1D samples. IfTrue,statisticwill be passed keyword argumentaxisand is expected to calculate the statistic alongaxiswhen passed an ND sample array. IfNone(default),vectorizedwill be setTrueifaxisis a parameter ofstatistic. Use of a vectorized statistic typically reduces computation time.n_resamples: int or np.inf, default: 9999Number of random permutations (resamples) used to approximate the null distribution. If greater than or equal to the number of distinct permutations, the exact null distribution will be computed. Note that the number of distinct permutations grows very rapidly with the sizes of samples, so exact tests are feasible only for very small data sets.
batch: int, optionalThe number of permutations to process in each call to
statistic. Memory usage is O(batch*n), wherenis the total size of all samples, regardless of the value ofvectorized. Default isNone, in which casebatchis the number of permutations.alternative: {'two-sided', 'less', 'greater'}, optionalThe alternative hypothesis for which the p-value is calculated. For each alternative, the p-value is defined for exact tests as follows.
'greater'the percentage of the null distribution that is greater than or equal to the observed value of the test statistic.'less'the percentage of the null distribution that is less than or equal to the observed value of the test statistic.'two-sided'(default)twice the smaller of the p-values above.
Note that p-values for randomized tests are calculated according to the conservative (over-estimated) approximation suggested in [2] and [3] rather than the unbiased estimator suggested in [4]. That is, when calculating the proportion of the randomized null distribution that is as extreme as the observed value of the test statistic, the values in the numerator and denominator are both increased by one. An interpretation of this adjustment is that the observed value of the test statistic is always included as an element of the randomized null distribution. The convention used for two-sided p-values is not universal; the observed test statistic and null distribution are returned in case a different definition is preferred.
axis: int, default: 0The axis of the (broadcasted) samples over which to calculate the statistic. If samples have a different number of dimensions, singleton dimensions are prepended to samples with fewer dimensions before
axisis considered.rng: {None, int, `numpy.random.Generator`}, optionalIf
rngis passed by keyword, types other than numpy.random.Generator are passed to numpy.random.default_rng to instantiate aGenerator. Ifrngis already aGeneratorinstance, then the provided instance is used. Specifyrngfor repeatable function behavior.If this argument is passed by position or
random_stateis passed by keyword, legacy behavior for the argumentrandom_stateapplies:If
random_stateis None (or numpy.random), the numpy.random.RandomState singleton is used.If
random_stateis an int, a newRandomStateinstance is used, seeded withrandom_state.If
random_stateis already aGeneratororRandomStateinstance then that instance is used.
Returns
res: PermutationTestResultAn object with attributes:
statistic
statistic
pvalue
pvalue
null_distribution
null_distribution
Notes
The three types of permutation tests supported by this function are described below.
Unpaired statistics (permutation_type='independent'):
The null hypothesis associated with this permutation type is that all observations are sampled from the same underlying distribution and that they have been assigned to one of the samples at random.
Suppose data contains two samples; e.g. a, b = data. When 1 < n_resamples < binom(n, k), where
kis the number of observations ina,nis the total number of observations inaandb, andbinom(n, k)is the binomial coefficient (nchoosek),
the data are pooled (concatenated), randomly assigned to either the first or second sample, and the statistic is calculated. This process is performed repeatedly, permutation times, generating a distribution of the statistic under the null hypothesis. The statistic of the original data is compared to this distribution to determine the p-value.
When n_resamples >= binom(n, k), an exact test is performed: the data are partitioned between the samples in each distinct way exactly once, and the exact null distribution is formed. Note that for a given partitioning of the data between the samples, only one ordering/permutation of the data within each sample is considered. For statistics that do not depend on the order of the data within samples, this dramatically reduces computational cost without affecting the shape of the null distribution (because the frequency/count of each value is affected by the same factor).
For a = [a1, a2, a3, a4] and b = [b1, b2, b3], an example of this permutation type is x = [b3, a1, a2, b2] and y = [a4, b1, a3]. Because only one ordering/permutation of the data within each sample is considered in an exact test, a resampling like x = [b3, a1, b2, a2] and y = [a4, a3, b1] would not be considered distinct from the example above.
permutation_type='independent' does not support one-sample statistics, but it can be applied to statistics with more than two samples. In this case, if n is an array of the number of observations within each sample, the number of distinct partitions is
np.prod([binom(sum(n[i:]), sum(n[i+1:])) for i in range(len(n)-1)])Paired statistics, permute pairings (permutation_type='pairings'):
The null hypothesis associated with this permutation type is that observations within each sample are drawn from the same underlying distribution and that pairings with elements of other samples are assigned at random.
Suppose data contains only one sample; e.g. a, = data, and we wish to consider all possible pairings of elements of a with elements of a second sample, b. Let n be the number of observations in a, which must also equal the number of observations in b.
When 1 < n_resamples < factorial(n), the elements of a are randomly permuted. The user-supplied statistic accepts one data argument, say a_perm, and calculates the statistic considering a_perm and b. This process is performed repeatedly, permutation times, generating a distribution of the statistic under the null hypothesis. The statistic of the original data is compared to this distribution to determine the p-value.
When n_resamples >= factorial(n), an exact test is performed: a is permuted in each distinct way exactly once. Therefore, the statistic is computed for each unique pairing of samples between a and b exactly once.
For a = [a1, a2, a3] and b = [b1, b2, b3], an example of this permutation type is a_perm = [a3, a1, a2] while b is left in its original order.
permutation_type='pairings' supports data containing any number of samples, each of which must contain the same number of observations. All samples provided in data are permuted independently. Therefore, if m is the number of samples and n is the number of observations within each sample, then the number of permutations in an exact test is
factorial(n)**mNote that if a two-sample statistic, for example, does not inherently depend on the order in which observations are provided - only on the pairings of observations - then only one of the two samples should be provided in data. This dramatically reduces computational cost without affecting the shape of the null distribution (because the frequency/count of each value is affected by the same factor).
Paired statistics, permute samples (permutation_type='samples'):
The null hypothesis associated with this permutation type is that observations within each pair are drawn from the same underlying distribution and that the sample to which they are assigned is random.
Suppose data contains two samples; e.g. a, b = data. Let n be the number of observations in a, which must also equal the number of observations in b.
When 1 < n_resamples < 2**n, the elements of a are b are randomly swapped between samples (maintaining their pairings) and the statistic is calculated. This process is performed repeatedly, permutation times, generating a distribution of the statistic under the null hypothesis. The statistic of the original data is compared to this distribution to determine the p-value.
When n_resamples >= 2**n, an exact test is performed: the observations are assigned to the two samples in each distinct way (while maintaining pairings) exactly once.
For a = [a1, a2, a3] and b = [b1, b2, b3], an example of this permutation type is x = [b1, a2, b3] and y = [a1, b2, a3].
permutation_type='samples' supports data containing any number of samples, each of which must contain the same number of observations. If data contains more than one sample, paired observations within data are exchanged between samples independently. Therefore, if m is the number of samples and n is the number of observations within each sample, then the number of permutations in an exact test is
factorial(m)**nSeveral paired-sample statistical tests, such as the Wilcoxon signed rank test and paired-sample t-test, can be performed considering only the difference between two paired elements. Accordingly, if data contains only one sample, then the null distribution is formed by independently changing the sign of each observation.
Array API Standard Support
permutation_test has experimental support for Python Array API Standard compatible backends in addition to NumPy. Please consider testing these features by setting an environment variable SCIPY_ARRAY_API=1 and providing CuPy, PyTorch, JAX, or Dask arrays as array arguments. The following combinations of backend and device (or other capability) are supported.
====================  ====================  ====================
Library               CPU                   GPU
====================  ====================  ====================
NumPy                 ✅                     n/a
CuPy                  n/a                   ✅
PyTorch               ✅                     ✅
JAX                   ✅                     ✅
Dask                  ⛔                     n/a
====================  ====================  ====================
See
dev-arrayapifor more information.
Examples
Suppose we wish to test whether two samples are drawn from the same distribution. Assume that the underlying distributions are unknown to us, and that before observing the data, we hypothesized that the mean of the first sample would be less than that of the second sample. We decide that we will use the difference between the sample means as a test statistic, and we will consider a p-value of 0.05 to be statistically significant. For efficiency, we write the function defining the test statistic in a vectorized fashion: the samples ``x`` and ``y`` can be ND arrays, and the statistic will be calculated for each axis-slice along `axis`.import numpy as np def statistic(x, y, axis): return np.mean(x, axis=axis) - np.mean(y, axis=axis)✓
from scipy.stats import norm
rng = np.random.default_rng()
x = norm.rvs(size=5, random_state=rng)
y = norm.rvs(size=6, loc = 3, random_state=rng)
✓
statistic(x, y, 0)
✗from scipy.stats import permutation_test res = permutation_test((x, y), statistic, vectorized=True, n_resamples=np.inf, alternative='less')✓
print(res.statistic)
✗print(res.pvalue)
✓x = norm.rvs(size=100, random_state=rng) y = norm.rvs(size=120, loc=0.2, random_state=rng) res = permutation_test((x, y), statistic, n_resamples=9999, vectorized=True, alternative='less', rng=rng)✓
print(res.statistic)
print(res.pvalue)
✗
from scipy.stats import ttest_ind
res_asymptotic = ttest_ind(x, y, alternative='less')
✓
print(res_asymptotic.pvalue)
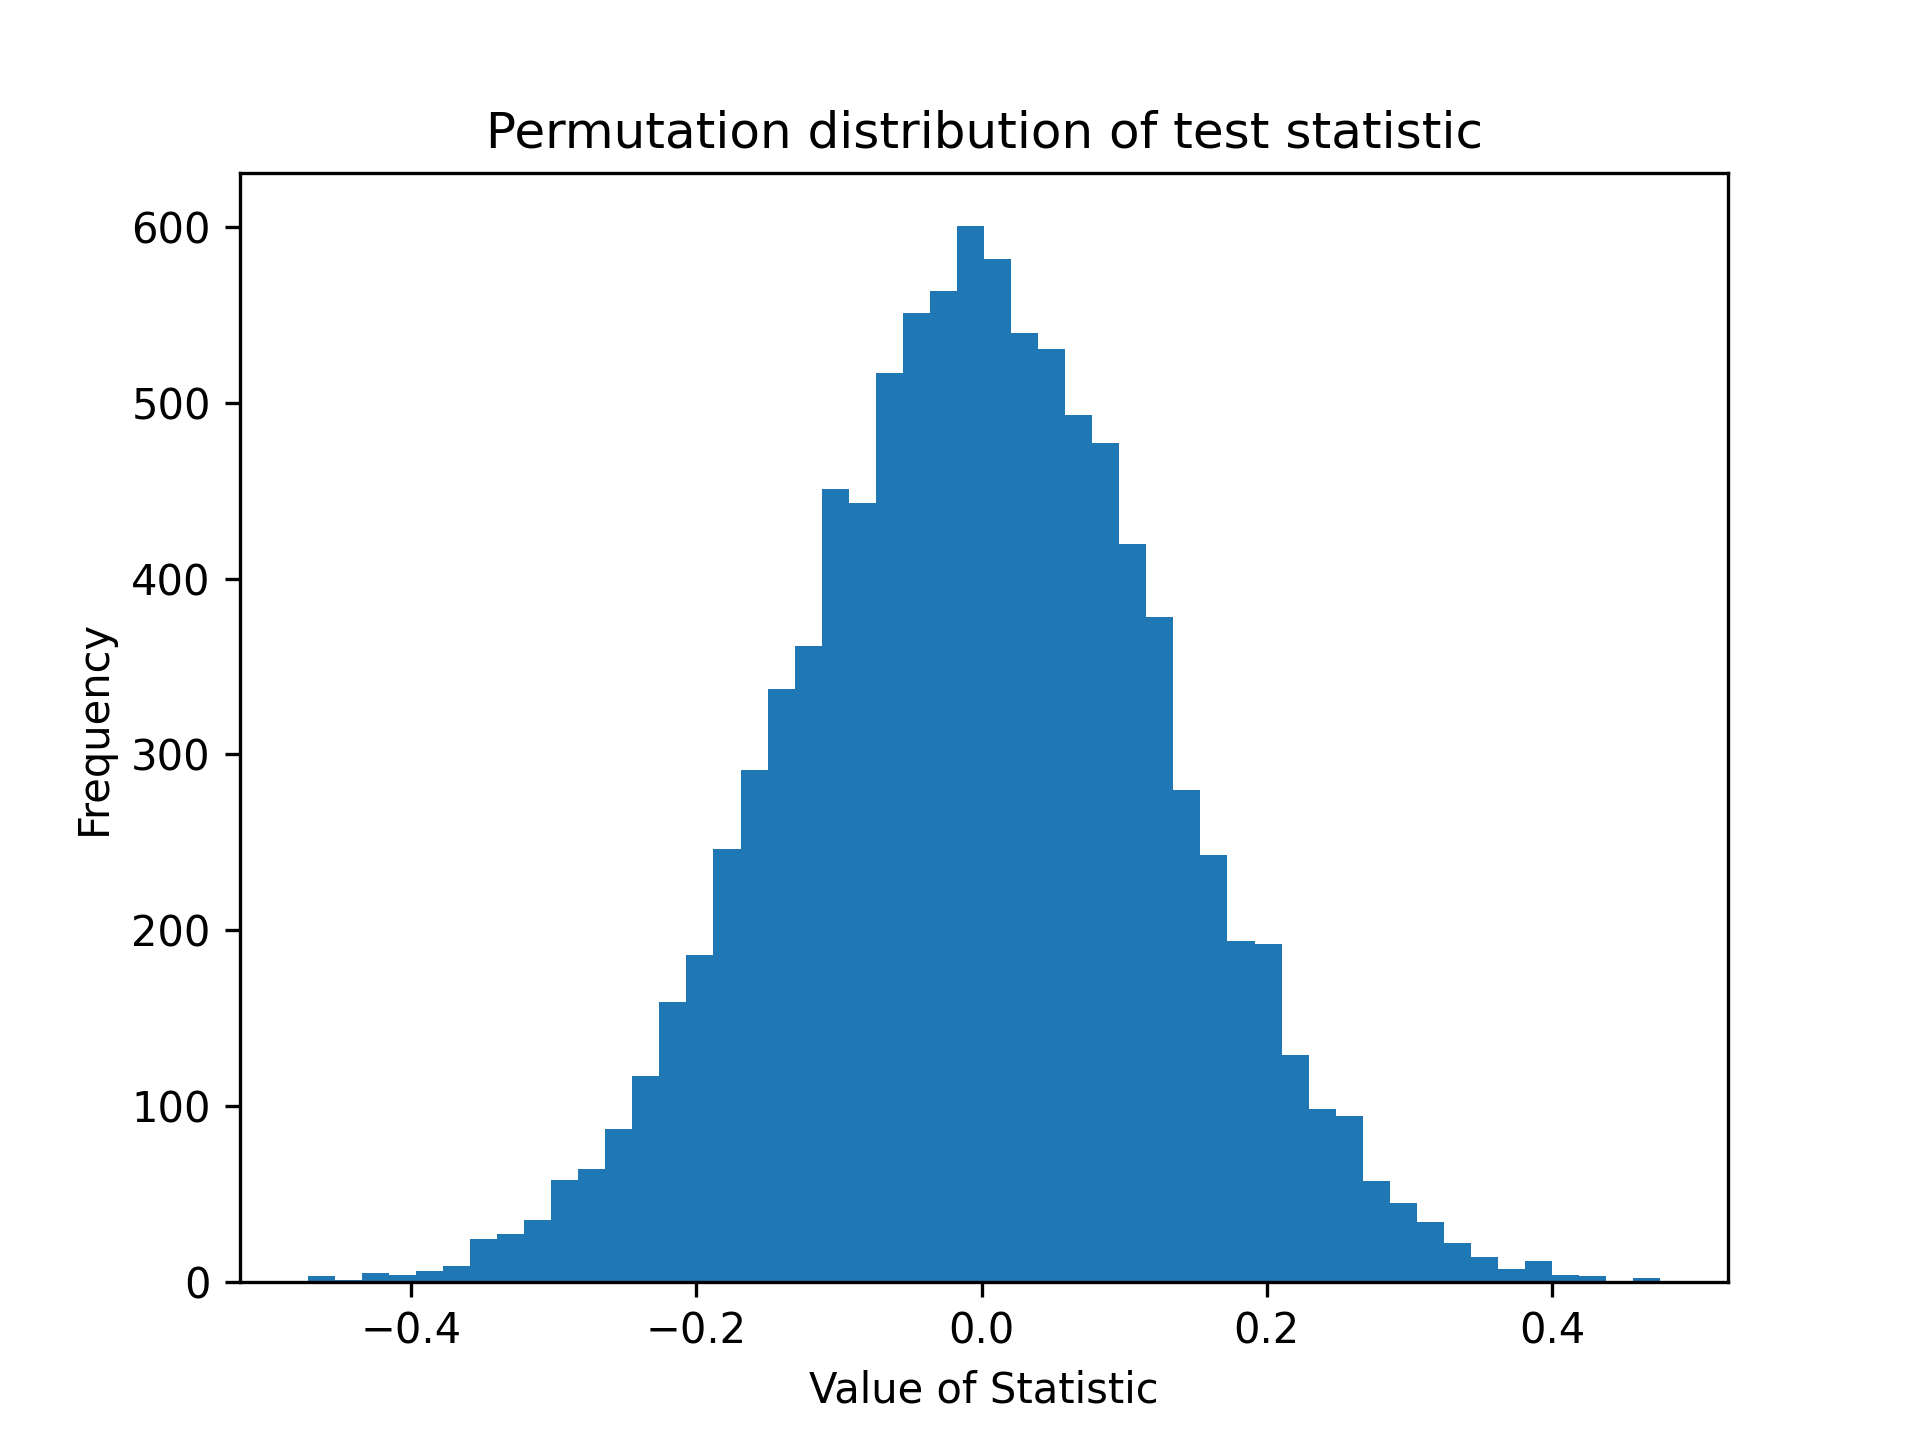
✗import matplotlib.pyplot as plt
✓plt.hist(res.null_distribution, bins=50) plt.title("Permutation distribution of test statistic") plt.xlabel("Value of Statistic") plt.ylabel("Frequency")✗
plt.show()
✓
from scipy.stats import pearsonr
x = [1, 2, 4, 3]
y = [2, 4, 6, 8]
def statistic(x, y, axis=-1):
    return pearsonr(x, y, axis=axis).statistic
res = permutation_test((x, y), statistic, vectorized=True,
                       permutation_type='pairings',
                       alternative='greater')
r, pvalue, null = res.statistic, res.pvalue, res.null_distribution
✓
r
✗unique = np.unique(null)
✓unique unique[np.isclose(r, unique)].tolist()✗
incorrect_pvalue = np.count_nonzero(null >= r) / len(null)
✓incorrect_pvalue
✗correct_pvalue = np.count_nonzero(null >= r - 1e-14) / len(null)
✓correct_pvalue res.pvalue == correct_pvalue✗
Aliases
-
scipy.stats.permutation_test