bundles / scipy 1.17.1 / scipy / stats / _stats_mstats_common / siegelslopes
function
scipy.stats._stats_mstats_common:siegelslopes
Signature
def siegelslopes ( y , x = None , method = hierarchical , * , axis = None , nan_policy = propagate , keepdims = False ) Summary
Computes the Siegel estimator for a set of points (x, y).
Extended Summary
siegelslopes implements a method for robust linear regression using repeated medians (see [1]) to fit a line to the points (x, y). The method is robust to outliers with an asymptotic breakdown point of 50%.
Parameters
y: array_likeDependent variable.
x: array_like or None, optionalIndependent variable. If None, use
arange(len(y))instead.method: {'hierarchical', 'separate'}If 'hierarchical', estimate the intercept using the estimated slope
slope(default option). If 'separate', estimate the intercept independent of the estimated slope. See Notes for details.axis: int or None, default: NoneIf an int, the axis of the input along which to compute the statistic. The statistic of each axis-slice (e.g. row) of the input will appear in a corresponding element of the output. If
None, the input will be raveled before computing the statistic.nan_policy: {'propagate', 'omit', 'raise'}Defines how to handle input NaNs.
propagate: if a NaN is present in the axis slice (e.g. row) along which the statistic is computed, the corresponding entry of the output will be NaN.omit: NaNs will be omitted when performing the calculation. If insufficient data remains in the axis slice along which the statistic is computed, the corresponding entry of the output will be NaN.raise: if a NaN is present, aValueErrorwill be raised.
keepdims: bool, default: FalseIf this is set to True, the axes which are reduced are left in the result as dimensions with size one. With this option, the result will broadcast correctly against the input array.
Returns
result: ``SiegelslopesResult`` instanceThe return value is an object with the following attributes:
slope
slope
intercept
intercept
Notes
With n = len(y), compute m_j as the median of the slopes from the point (x[j], y[j]) to all other n-1 points. slope is then the median of all slopes m_j. Two ways are given to estimate the intercept in [1] which can be chosen via the parameter method. The hierarchical approach uses the estimated slope slope and computes intercept as the median of y - slope*x. The other approach estimates the intercept separately as follows: for each point (x[j], y[j]), compute the intercepts of all the n-1 lines through the remaining points and take the median i_j. intercept is the median of the i_j.
The implementation computes n times the median of a vector of size n which can be slow for large vectors. There are more efficient algorithms (see [2]) which are not implemented here.
For compatibility with older versions of SciPy, the return value acts like a namedtuple of length 2, with fields slope and intercept, so one can continue to write
slope, intercept = siegelslopes(y, x)Beginning in SciPy 1.9, np.matrix inputs (not recommended for new code) are converted to np.ndarray before the calculation is performed. In this case, the output will be a scalar or np.ndarray of appropriate shape rather than a 2D np.matrix. Similarly, while masked elements of masked arrays are ignored, the output will be a scalar or np.ndarray rather than a masked array with mask=False.
Array API Standard Support
siegelslopes has experimental support for Python Array API Standard compatible backends in addition to NumPy. Please consider testing these features by setting an environment variable SCIPY_ARRAY_API=1 and providing CuPy, PyTorch, JAX, or Dask arrays as array arguments. The following combinations of backend and device (or other capability) are supported.
====================  ====================  ====================
Library               CPU                   GPU
====================  ====================  ====================
NumPy                 ✅                     n/a
CuPy                  n/a                   ⛔
PyTorch               ⛔                     ⛔
JAX                   ⛔                     ⛔
Dask                  ⛔                     n/a
====================  ====================  ====================
See
dev-arrayapifor more information.
Examples
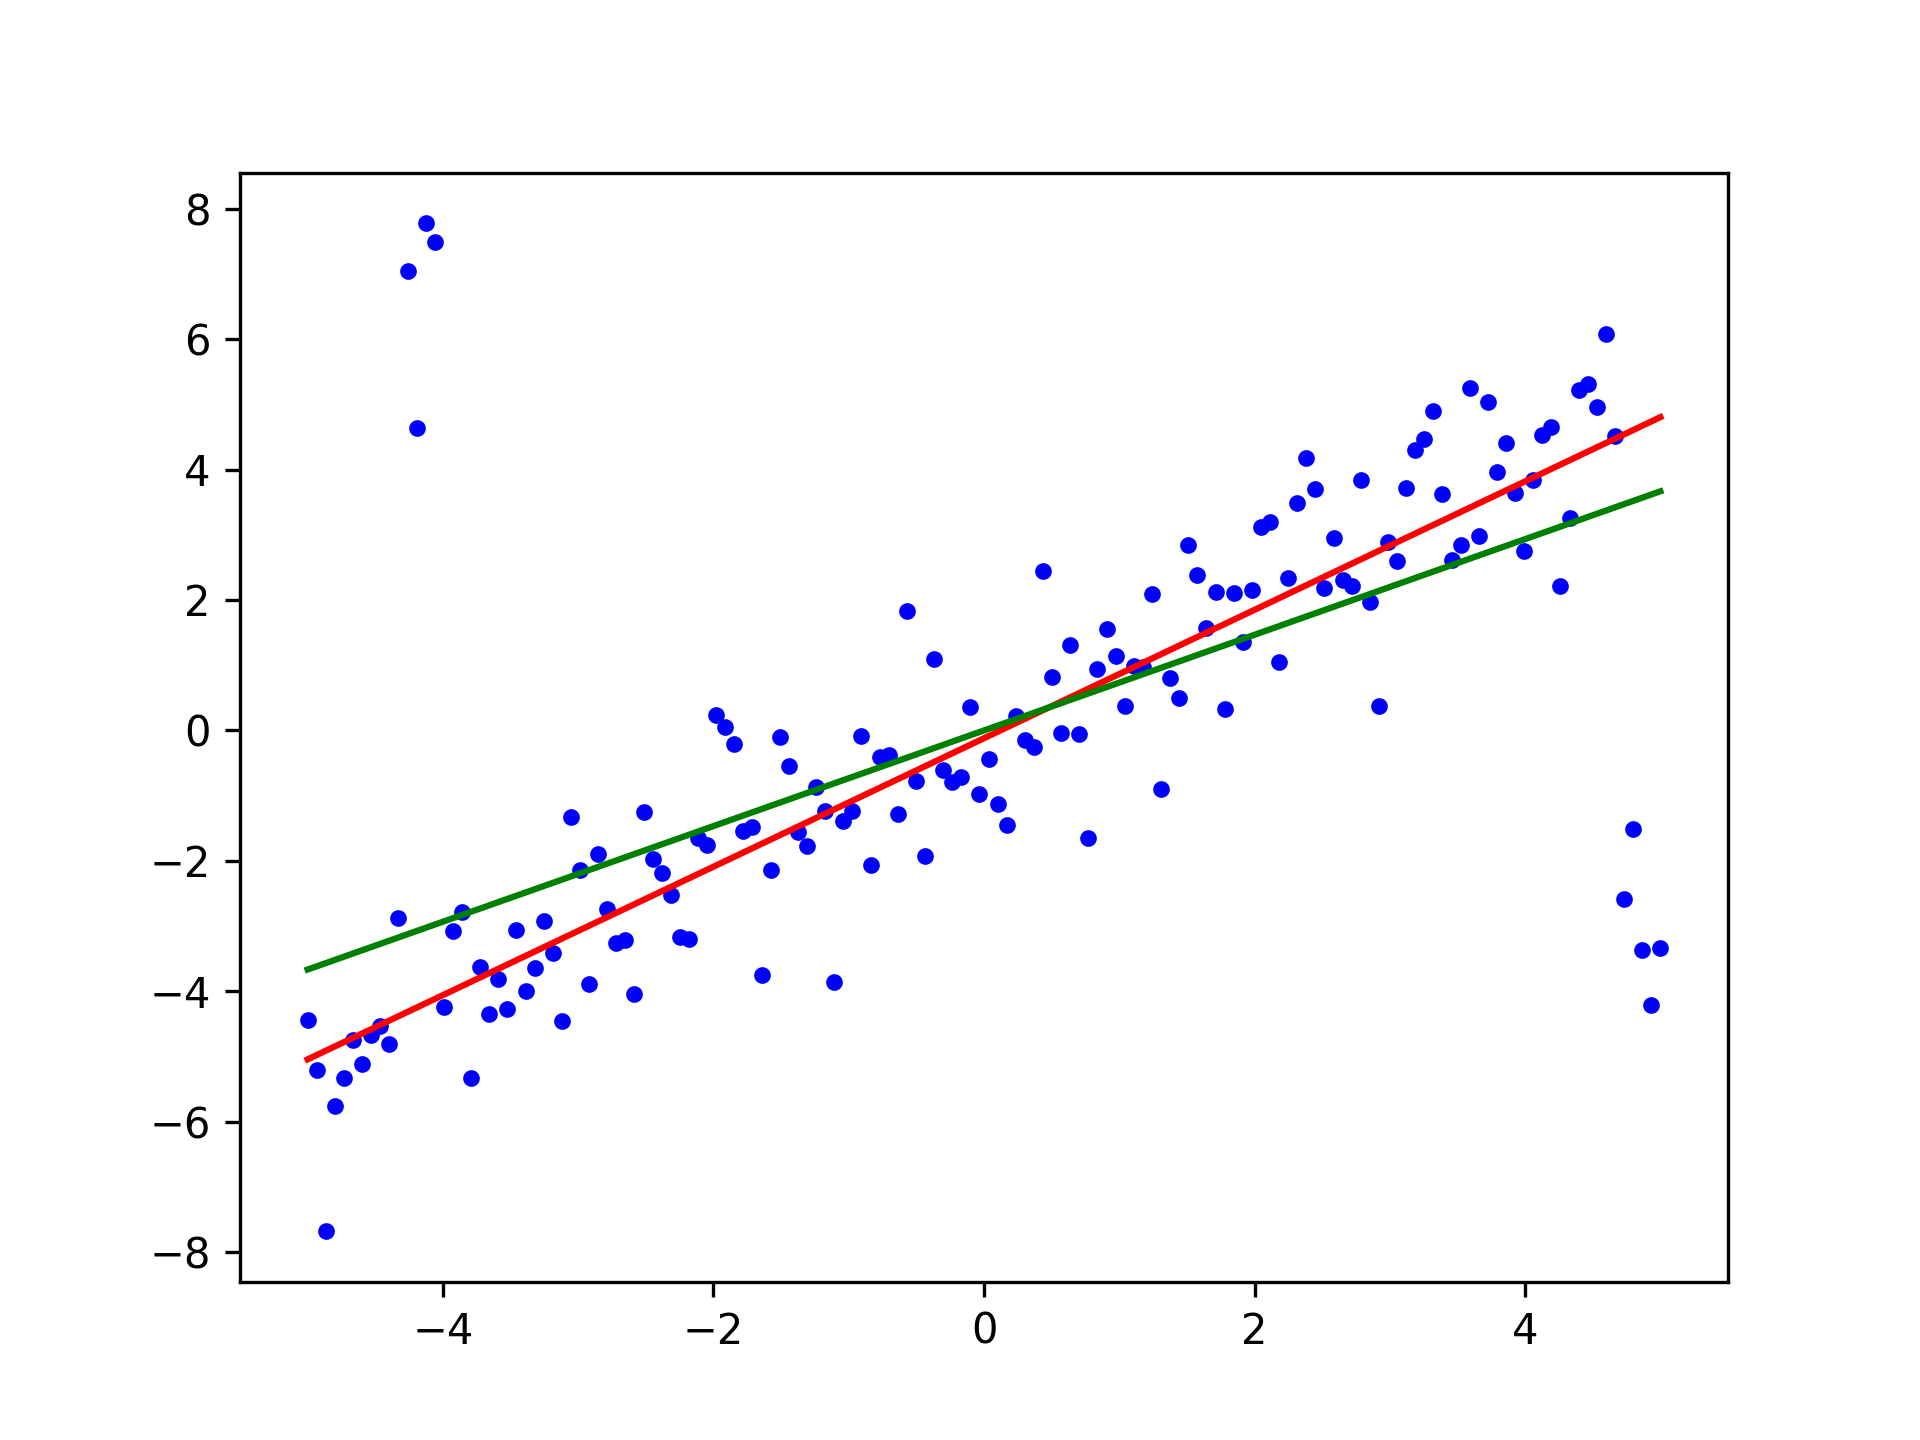
import numpy as np
from scipy import stats
import matplotlib.pyplot as plt
✓
x = np.linspace(-5, 5, num=150)
y = x + np.random.normal(size=x.size)
y[11:15] += 10  # add outliers
y[-5:] -= 7
✓
res = stats.siegelslopes(y, x)
lsq_res = stats.linregress(x, y)
✓
fig = plt.figure()
ax = fig.add_subplot(111)
✓
ax.plot(x, y, 'b.')
ax.plot(x, res[1] + res[0] * x, 'r-')
ax.plot(x, lsq_res[1] + lsq_res[0] * x, 'g-')
✗
plt.show()
✓
See also
- theilslopes
a similar technique without repeated medians
Aliases
-
scipy.stats.siegelslopes