bundles / scipy 1.17.1 / scipy / stats / _stats_py / relfreq
function
scipy.stats._stats_py:relfreq
source: /scipy/stats/_stats_py.py :2424
Signature
def relfreq ( a , numbins = 10 , defaultreallimits = None , weights = None ) Summary
Return a relative frequency histogram, using the histogram function.
Extended Summary
A relative frequency histogram is a mapping of the number of observations in each of the bins relative to the total of observations.
Parameters
a: array_likeInput array.
numbins: int, optionalThe number of bins to use for the histogram. Default is 10.
defaultreallimits: tuple (lower, upper), optionalThe lower and upper values for the range of the histogram. If no value is given, a range slightly larger than the range of the values in a is used. Specifically
(a.min() - s, a.max() + s), wheres = (1/2)(a.max() - a.min()) / (numbins - 1).weights: array_like, optionalThe weights for each value in
a. Default is None, which gives each value a weight of 1.0
Returns
frequency: ndarrayBinned values of relative frequency.
lowerlimit: floatLower real limit.
binsize: floatWidth of each bin.
extrapoints: intExtra points.
Notes
Array API Standard Support
relfreq has experimental support for Python Array API Standard compatible backends in addition to NumPy. Please consider testing these features by setting an environment variable SCIPY_ARRAY_API=1 and providing CuPy, PyTorch, JAX, or Dask arrays as array arguments. The following combinations of backend and device (or other capability) are supported.
====================  ====================  ====================
Library               CPU                   GPU
====================  ====================  ====================
NumPy                 ✅                     n/a
CuPy                  n/a                   ⛔
PyTorch               ⛔                     ⛔
JAX                   ⛔                     ⛔
Dask                  ⛔                     n/a
====================  ====================  ====================
See
dev-arrayapifor more information.
Examples
import numpy as np
import matplotlib.pyplot as plt
from scipy import stats
rng = np.random.default_rng()
a = np.array([2, 4, 1, 2, 3, 2])
res = stats.relfreq(a, numbins=4)
✓
res.frequency
np.sum(res.frequency)  # relative frequencies should add up to 1
✗
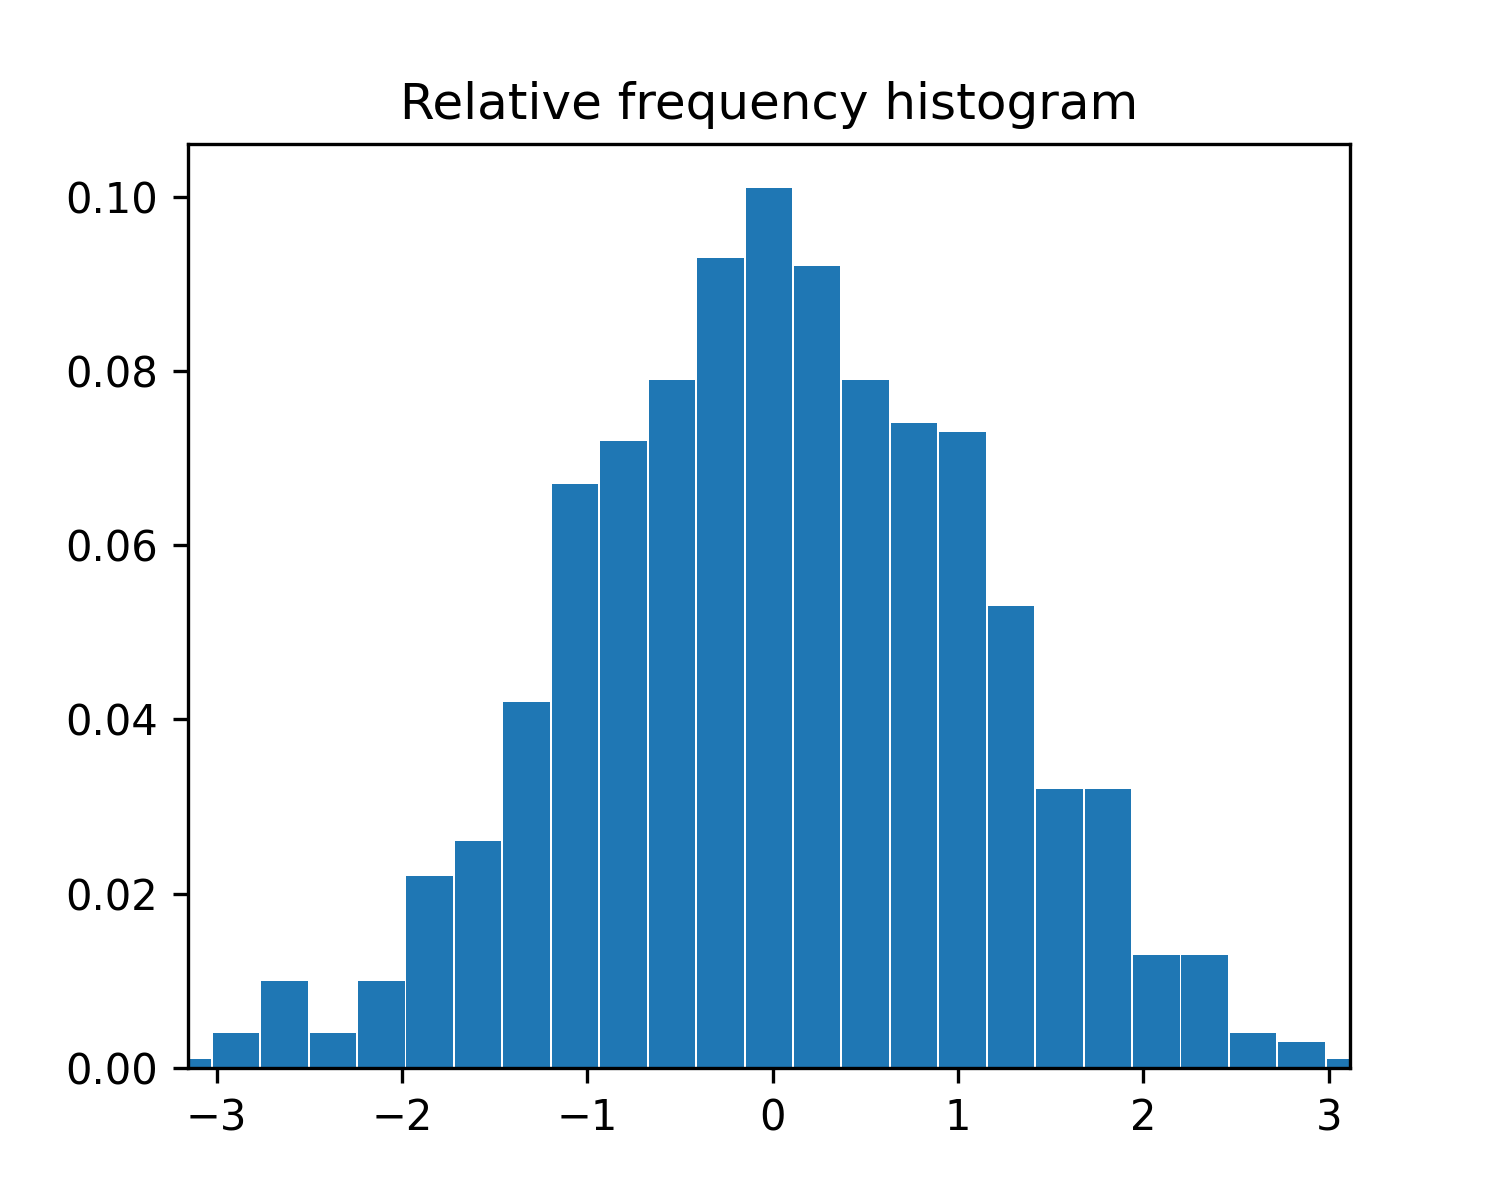
samples = stats.norm.rvs(size=1000, random_state=rng)
✓res = stats.relfreq(samples, numbins=25)
✓x = res.lowerlimit + np.linspace(0, res.binsize*res.frequency.size, res.frequency.size)✓
fig = plt.figure(figsize=(5, 4))
ax = fig.add_subplot(1, 1, 1)
✓
ax.bar(x, res.frequency, width=res.binsize)
ax.set_title('Relative frequency histogram')
ax.set_xlim([x.min(), x.max()])
✗
plt.show()
✓
Aliases
-
scipy.stats.relfreq