bundles / scipy 1.18.0 / scipy / interpolate / _ndgriddata / griddata
function
scipy.interpolate._ndgriddata:griddata
Signature
def griddata(points, values, xi, method = linear, fill_value = nan, rescale = False, simplex_tolerance = 1.0)Summary
Convenience function for interpolating unstructured data in multiple dimensions.
Parameters
points: 2-D ndarray of floats with shape (n, D), or length D tuple of 1-D ndarrays with shape (n,)Data point coordinates.
values: ndarray of float or complex, shape (n,)Data values.
xi: 2-D ndarray of floats with shape (m, D), or length D tuple of ndarrays broadcastable to the same shapePoints at which to interpolate data.
method: {'linear', 'nearest', 'cubic'}, optionalMethod of interpolation. One of
nearestreturn the value at the data point closest to the point of interpolation. See NearestNDInterpolator for more details.
lineartessellate the input point set to N-D simplices, and interpolate linearly on each simplex. See LinearNDInterpolator for more details.
cubic(1-D)return the value determined from a cubic spline.
cubic(2-D)return the value determined from a piecewise cubic, continuously differentiable (C1), and approximately curvature-minimizing polynomial surface. See CloughTocher2DInterpolator for more details.
fill_value: float, optionalValue used to fill in for requested points outside of the convex hull of the input points. If not provided, then the default is
nan. This option has no effect for the 'nearest' method.rescale: bool, optionalRescale points to unit cube before performing interpolation. This is useful if some of the input dimensions have incommensurable units and differ by many orders of magnitude.
simplex_tolerance: float, optionalMultiplier for the default tolerance QHull uses to assign a simplex to the xi. Default is 1.0. Increase if there are difficulties assigning points to simplexes; this is most reproducible with points exatly on the border of a very oblique triangle. Only relevant for linear and 2-D cubic interpolation.
Returns
: ndarrayArray of interpolated values.
Raises
: ValueErrorIf simplex_tolerance <= 0
Notes
Examples
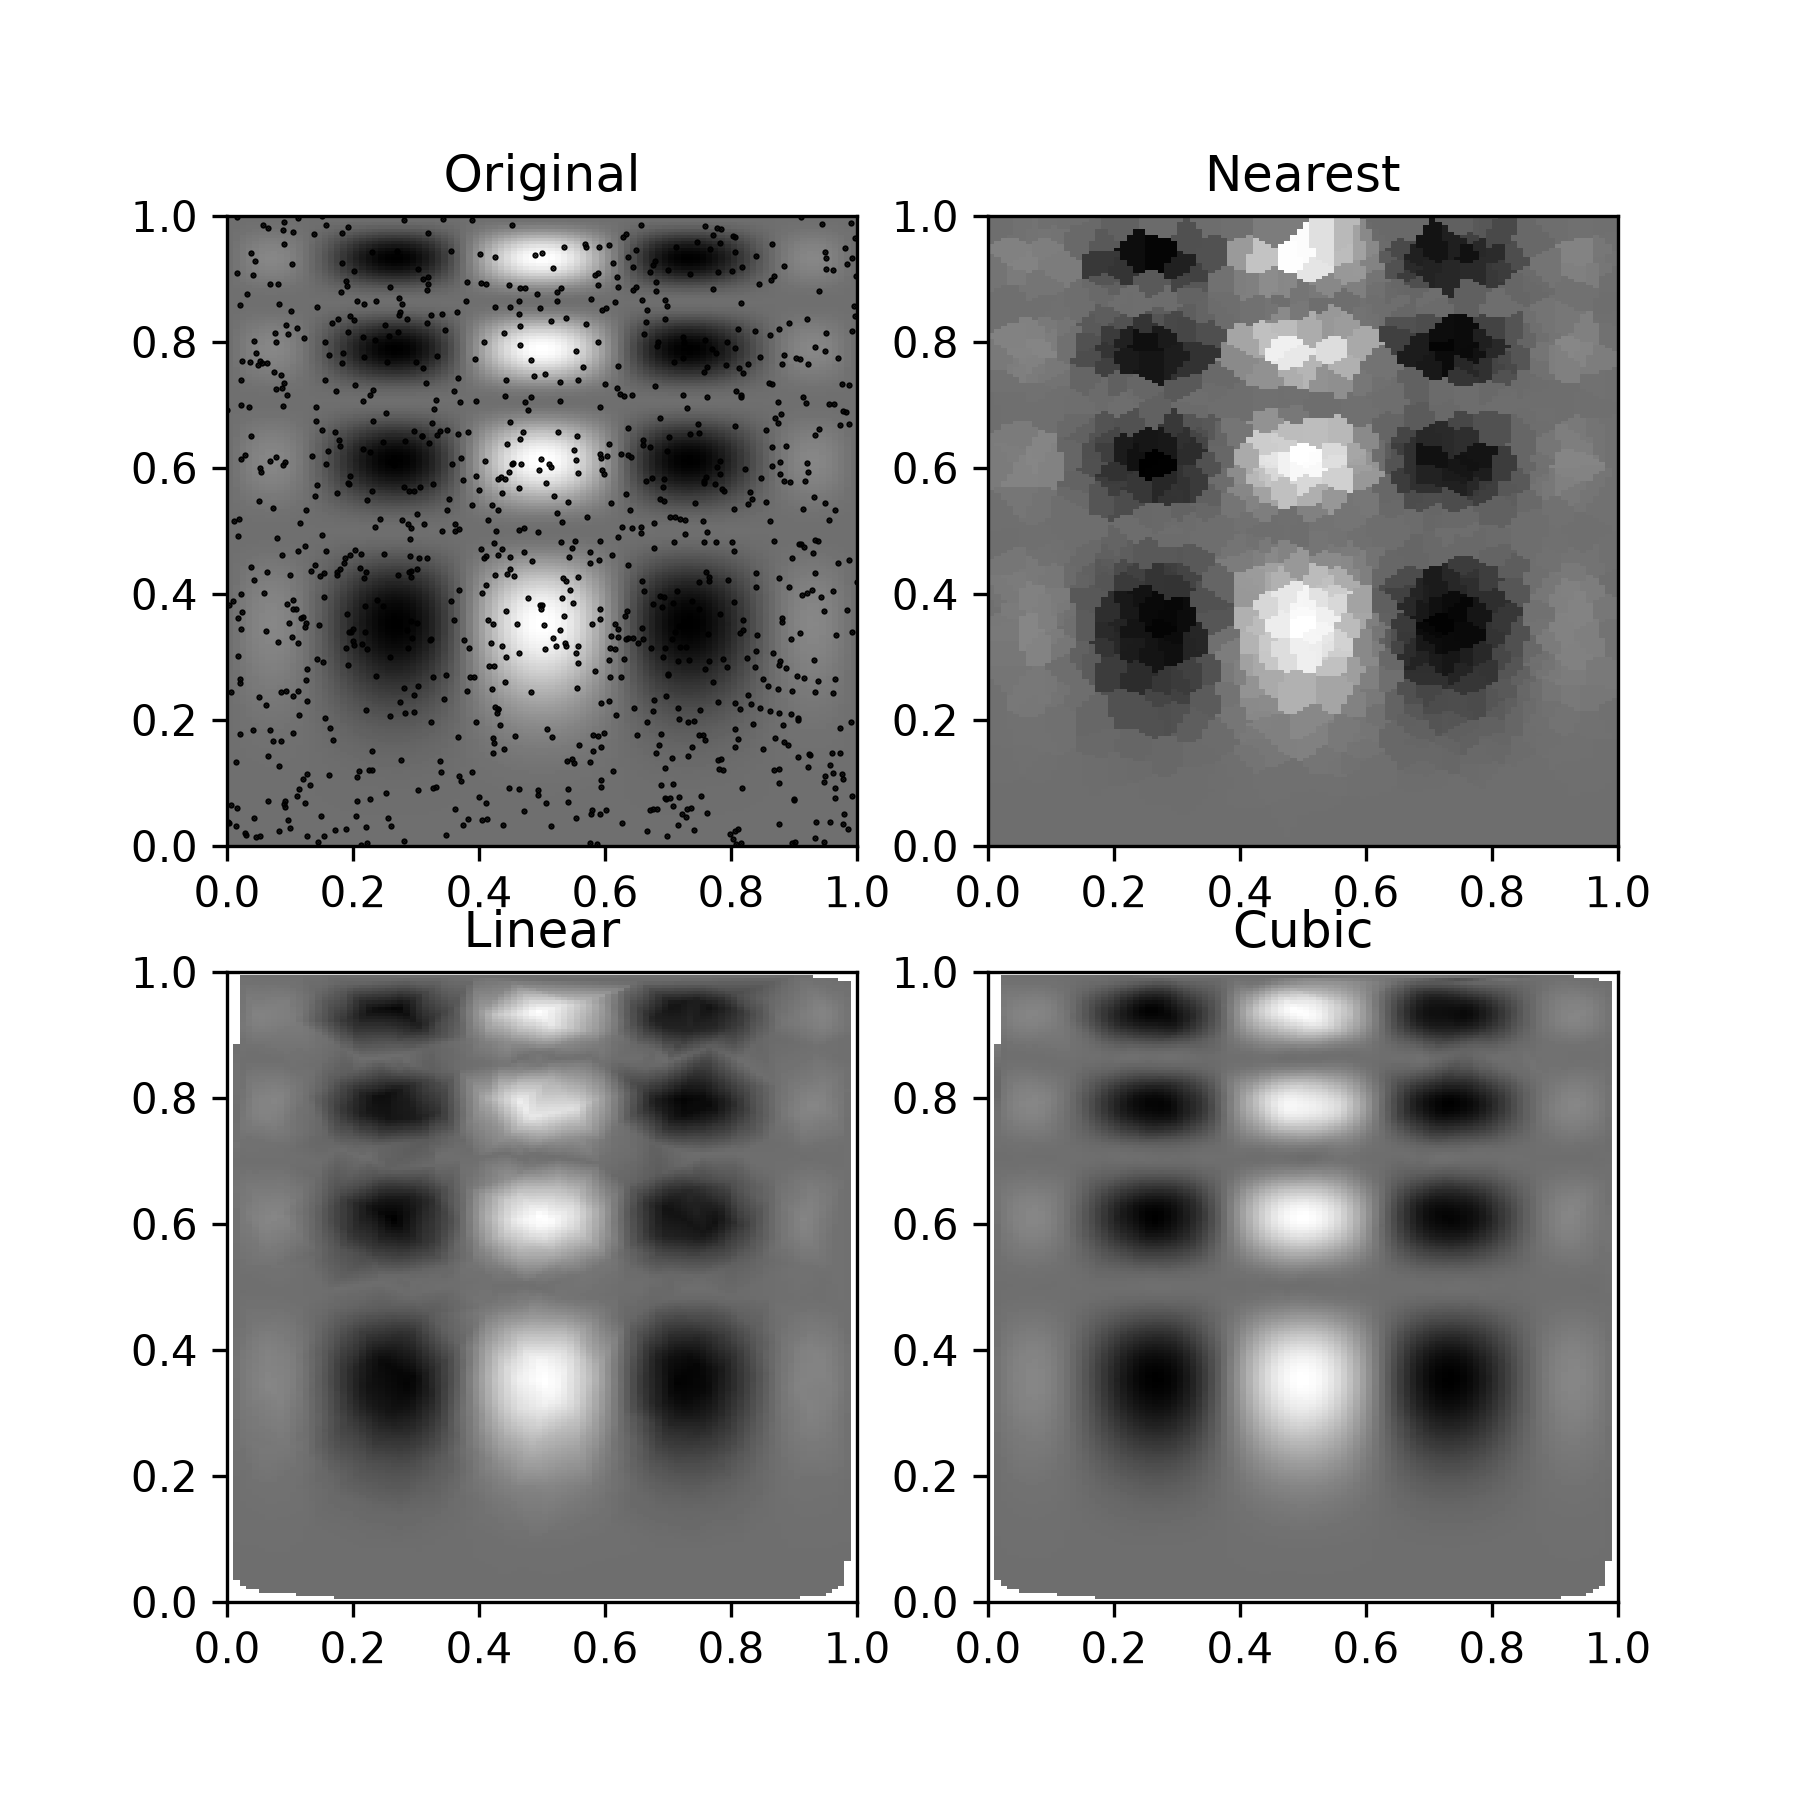
Suppose we want to interpolate the 2-D functionimport numpy as np def func(x, y): return x*(1-x)*np.cos(4*np.pi*x) * np.sin(4*np.pi*y**2)**2✓
grid_x, grid_y = np.mgrid[0:1:100j, 0:1:200j]
✓rng = np.random.default_rng() points = rng.random((1000, 2)) values = func(points[:,0], points[:,1])✓
from scipy.interpolate import griddata
grid_z0 = griddata(points, values, (grid_x, grid_y), method='nearest')
grid_z1 = griddata(points, values, (grid_x, grid_y), method='linear')
grid_z2 = griddata(points, values, (grid_x, grid_y), method='cubic')
✓
import matplotlib.pyplot as plt
✓plt.subplot(221) plt.imshow(func(grid_x, grid_y).T, extent=(0,1,0,1), origin='lower') plt.plot(points[:,0], points[:,1], 'k.', ms=1) plt.title('Original') plt.subplot(222) plt.imshow(grid_z0.T, extent=(0,1,0,1), origin='lower') plt.title('Nearest') plt.subplot(223) plt.imshow(grid_z1.T, extent=(0,1,0,1), origin='lower') plt.title('Linear') plt.subplot(224) plt.imshow(grid_z2.T, extent=(0,1,0,1), origin='lower') plt.title('Cubic')✗
Text(0.5, 1.0, 'Cubic')
plt.gcf().set_size_inches(6, 6)
plt.show()
✓
See also
- CloughTocher2DInterpolator
Piecewise cubic, C1 smooth, curvature-minimizing interpolator in 2D.
- LinearNDInterpolator
Piecewise linear interpolator in N dimensions.
- NearestNDInterpolator
Nearest-neighbor interpolator in N dimensions.
- RegularGridInterpolator
Interpolator on a regular or rectilinear grid in arbitrary dimensions (
interpnwraps this class).- interpn
Interpolation on a regular grid or rectilinear grid.
Aliases
scipy.interpolate.griddata