bundles / scipy 1.18.0 / scipy / ndimage / _fourier / fourier_ellipsoid
function
scipy.ndimage._fourier:fourier_ellipsoid
source: /scipy/ndimage/_fourier.py:186
Signature
def fourier_ellipsoid(input, size, n = -1, axis = -1, output = None)Summary
Multidimensional ellipsoid Fourier filter.
Extended Summary
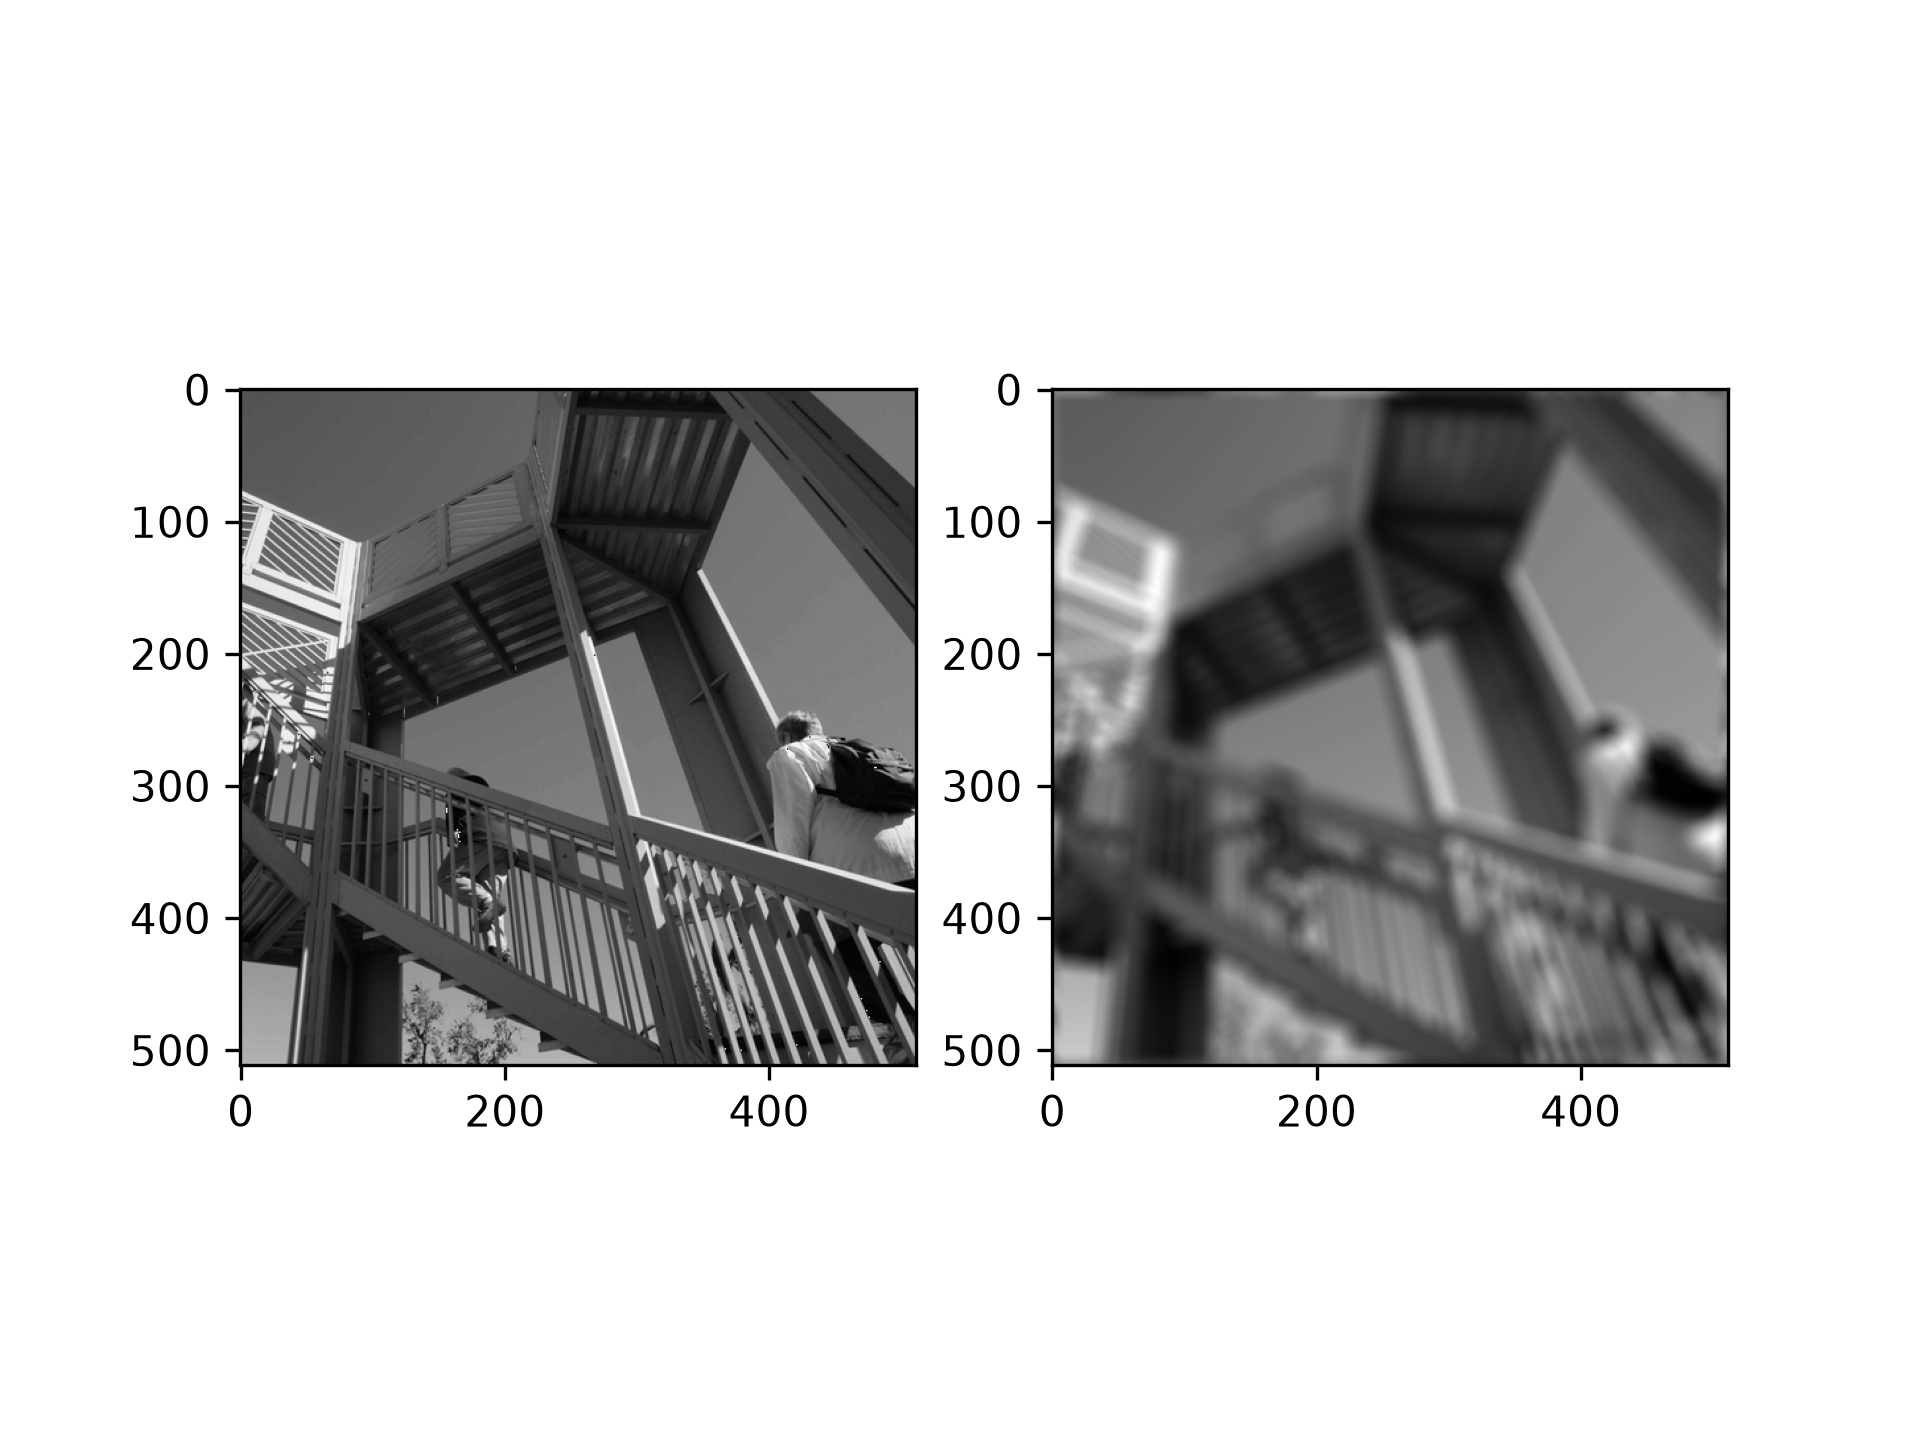
The array is multiplied with the fourier transform of an ellipsoid of given sizes.
Parameters
input: array_likeThe input array.
size: float or sequenceThe size of the box used for filtering. If a float,
sizeis the same for all axes. If a sequence,sizehas to contain one value for each axis.n: int, optionalIf
nis negative (default), then the input is assumed to be the result of a complex fft. Ifnis larger than or equal to zero, the input is assumed to be the result of a real fft, andngives the length of the array before transformation along the real transform direction.axis: int, optionalThe axis of the real transform.
output: ndarray, optionalIf given, the result of filtering the input is placed in this array.
Returns
fourier_ellipsoid: ndarrayThe filtered input.
Notes
This function is implemented for arrays of rank 1, 2, or 3.
Array API Standard Support
fourier_ellipsoid has experimental support for Python Array API Standard compatible backends in addition to NumPy. Please consider testing these features by setting an environment variable SCIPY_ARRAY_API=1 and providing CuPy, PyTorch, JAX, or Dask arrays as array arguments. The following combinations of backend and device (or other capability) are supported.
====================  ====================  ====================
Library               CPU                   GPU
====================  ====================  ====================
NumPy                 ✅                     n/a
CuPy                  n/a                   ✅
PyTorch               ✅                     ⛔
JAX                   ⚠️ no JIT             ⛔
Dask                  ⚠️ computes graph     n/a
====================  ====================  ====================
See dev-arrayapi for more information.
Examples
from scipy import ndimage, datasets
import numpy.fft
import matplotlib.pyplot as plt
fig, (ax1, ax2) = plt.subplots(1, 2)
plt.gray()  # show the filtered result in grayscale
ascent = datasets.ascent()
input_ = numpy.fft.fft2(ascent)
result = ndimage.fourier_ellipsoid(input_, size=20)
result = numpy.fft.ifft2(result)
✓
ax1.imshow(ascent)
ax2.imshow(result.real)  # the imaginary part is an artifact
✗
<matplotlib.image.AxesImage object at 0x7fa8fe8334d0>
plt.show()
✓
Aliases
scipy.ndimage.fourier_ellipsoid