bundles / scipy 1.18.0 / scipy / optimize / _optimize / rosen
function
scipy.optimize._optimize:rosen
source: /scipy/optimize/_optimize.py:341
Signature
def rosen(x)Summary
The Rosenbrock function.
Extended Summary
The function computed is
sum(100.0*(x[1:] - x[:-1]**2.0)**2.0 + (1 - x[:-1])**2.0)Parameters
x: array_like1-D array of points at which the Rosenbrock function is to be computed.
Returns
f: floatThe value of the Rosenbrock function.
Notes
Array API Standard Support
rosen has experimental support for Python Array API Standard compatible backends in addition to NumPy. Please consider testing these features by setting an environment variable SCIPY_ARRAY_API=1 and providing CuPy, PyTorch, JAX, or Dask arrays as array arguments. The following combinations of backend and device (or other capability) are supported.
====================  ====================  ====================
Library               CPU                   GPU
====================  ====================  ====================
NumPy                 ✅                     n/a
CuPy                  n/a                   ✅
PyTorch               ✅                     ✅
JAX                   ✅                     ✅
Dask                  ✅                     n/a
====================  ====================  ====================
See dev-arrayapi for more information.
Examples
import numpy as np
from scipy.optimize import rosen
X = 0.1 * np.arange(10)
✓
rosen(X)
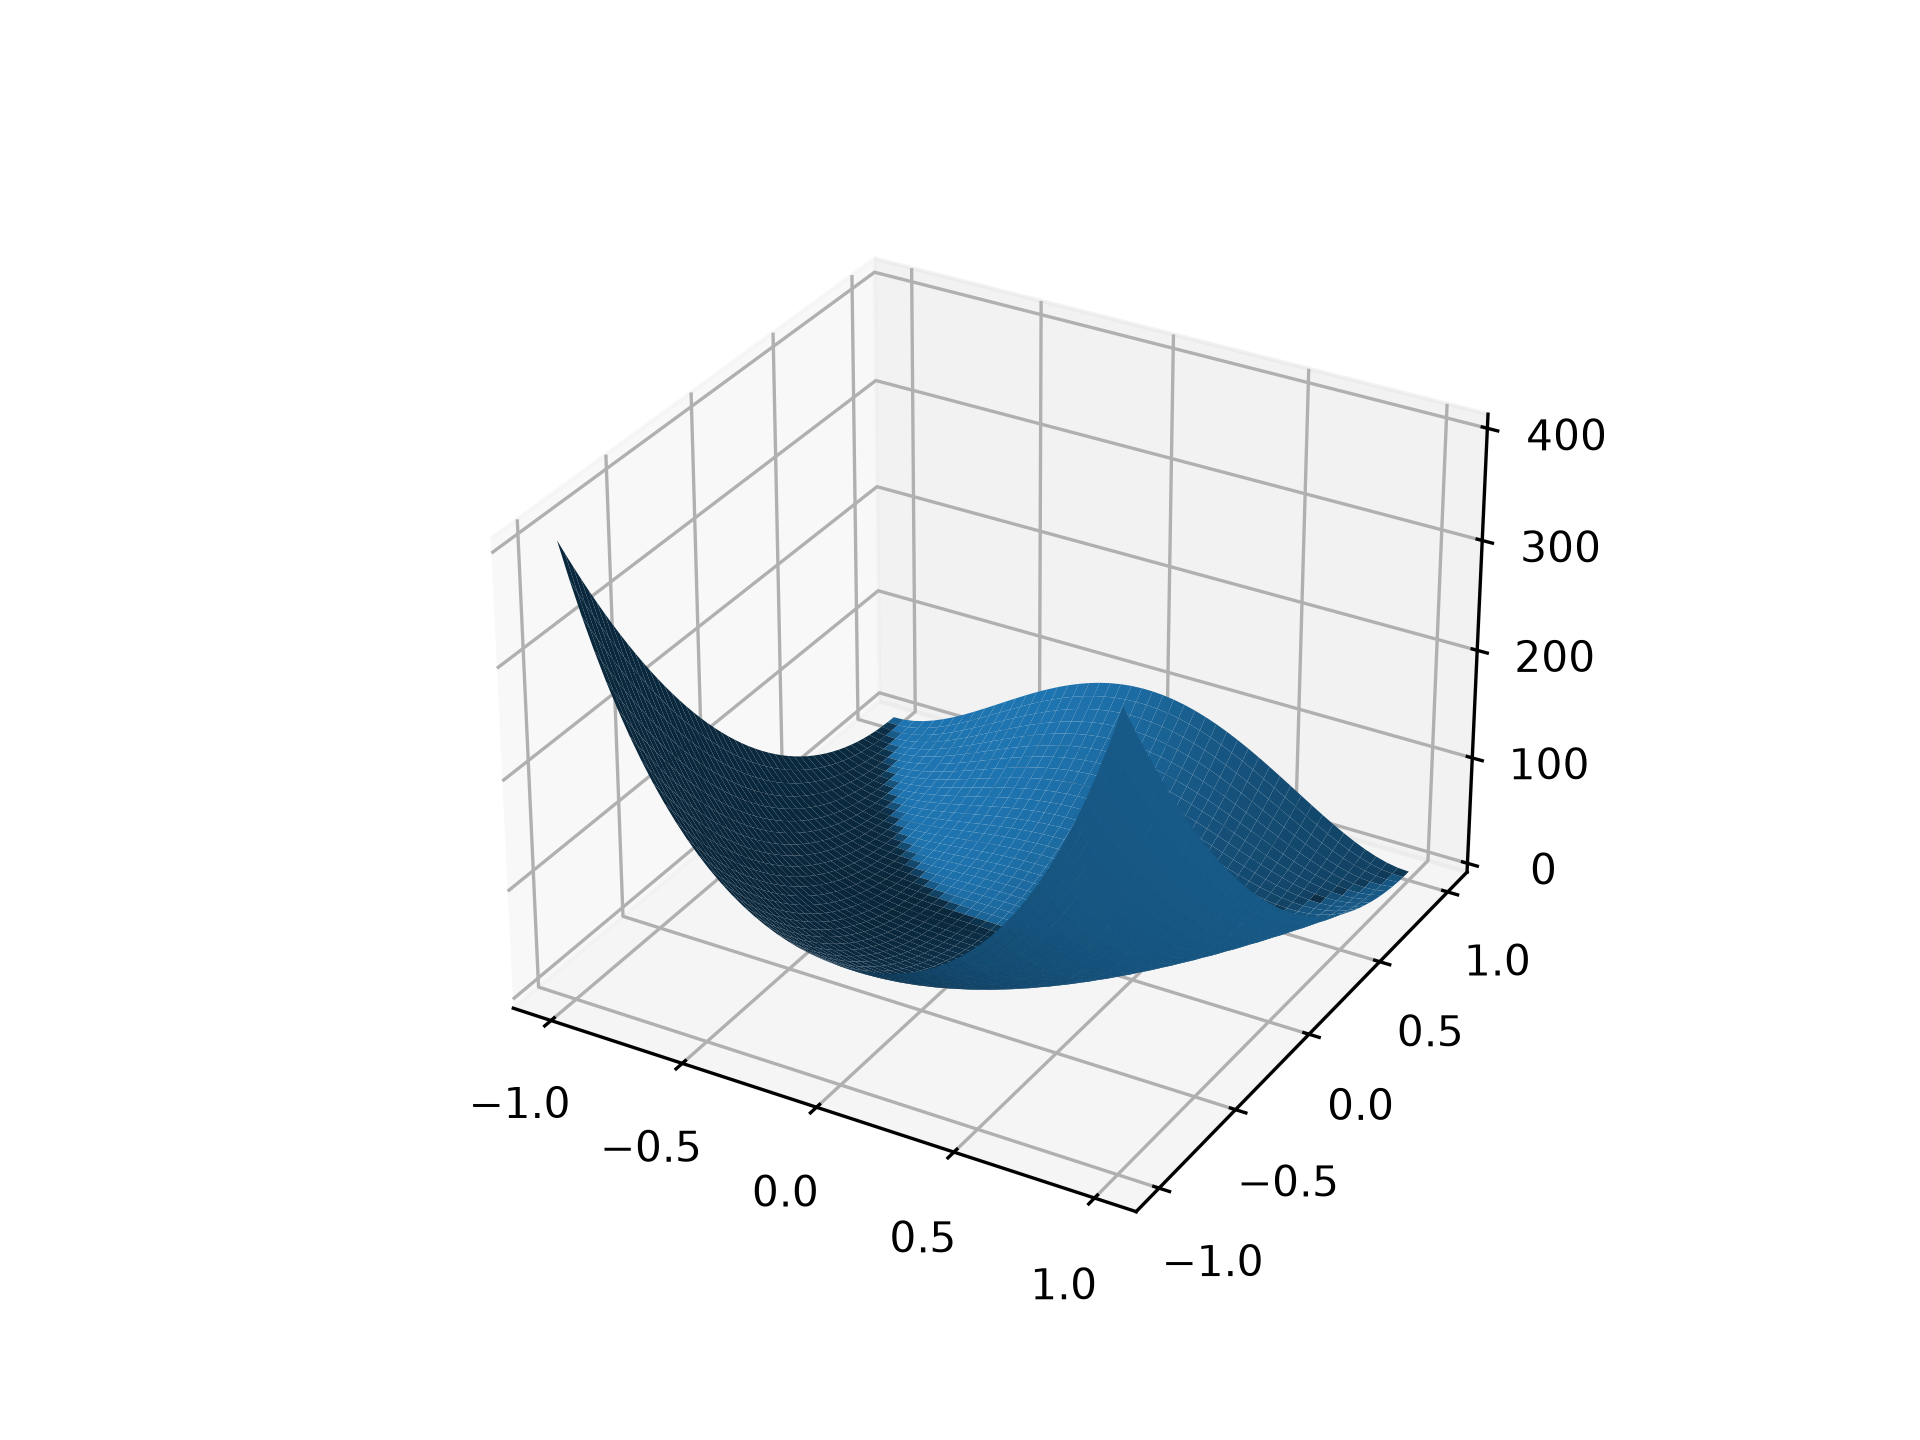
✗np.float64(76.56)For higher-dimensional input ``rosen`` broadcasts. In the following example, we use this to plot a 2D landscape. Note that ``rosen_hess`` does not broadcast in this manner.
import matplotlib.pyplot as plt
from mpl_toolkits.mplot3d import Axes3D
x = np.linspace(-1, 1, 50)
X, Y = np.meshgrid(x, x)
ax = plt.subplot(111, projection='3d')
✓
ax.plot_surface(X, Y, rosen([X, Y]))
✗<mpl_toolkits.mplot3d.art3d.Poly3DCollection object at 0x7fa8f43925d0>
plt.show()
✓
See also
Aliases
scipy.optimize.rosen