bundles / scipy 1.18.0 / scipy / signal / _fir_filter_design / minimum_phase
function
scipy.signal._fir_filter_design:minimum_phase
Signature
def minimum_phase(h, method: Literal['homomorphic', 'hilbert'] = homomorphic, n_fft: int | None = None, *, half: bool = True)Summary
Convert a linear-phase FIR filter to minimum phase.
Parameters
h: arrayLinear-phase FIR filter coefficients.
method: {'hilbert', 'homomorphic'}The provided methods are:
'homomorphic' (default): This method [4] [5] works best with filters with an odd number of taps, and the resulting minimum phase filter will have a magnitude response that approximates the square root of the original filter's magnitude response using half the number of taps when
half=True(default), or the original magnitude spectrum using the same number of taps whenhalf=False.'hilbert' This method [1] is designed to be used with equiripple filters (e.g., from remez) with unity or zero gain regions.
n_fft: intThe number of points to use for the FFT. Should be at least a few times larger than the signal length (see Notes).
half: boolIf
True, create a filter that is half the length of the original, with a magnitude spectrum that is the square root of the original. IfFalse, create a filter that is the same length as the original, with a magnitude spectrum that is designed to match the original (only supported whenmethod='homomorphic').
Returns
h_minimum: arrayThe minimum-phase version of the filter, with length
(len(h) + 1) // 2whenhalf is Trueorlen(h)otherwise.
Notes
Both the Hilbert [1] or homomorphic [4] [5] methods require selection of an FFT length to estimate the complex cepstrum of the filter.
In the case of the Hilbert method, the deviation from the ideal spectrum epsilon is related to the number of stopband zeros n_stop and FFT length n_fft as
epsilon = 2. * n_stop / n_fftFor example, with 100 stopband zeros and a FFT length of 2048, epsilon = 0.0976. If we conservatively assume that the number of stopband zeros is one less than the filter length, we can take the FFT length to be the next power of 2 that satisfies epsilon=0.01 as
n_fft = 2 ** int(np.ceil(np.log2(2 * (len(h) - 1) / 0.01)))This gives reasonable results for both the Hilbert and homomorphic methods, and gives the value used when n_fft=None.
Alternative implementations exist for creating minimum-phase filters, including zero inversion [2] and spectral factorization [3] [4]. For more information, see this DSPGuru page.
Array API Standard Support
minimum_phase has experimental support for Python Array API Standard compatible backends in addition to NumPy. Please consider testing these features by setting an environment variable SCIPY_ARRAY_API=1 and providing CuPy, PyTorch, JAX, or Dask arrays as array arguments. The following combinations of backend and device (or other capability) are supported.
====================  ====================  ====================
Library               CPU                   GPU
====================  ====================  ====================
NumPy                 ✅                     n/a
CuPy                  n/a                   ✅
PyTorch               ✅                     ✅
JAX                   ⚠️ no JIT             ⛔
Dask                  ⚠️ computes graph     n/a
====================  ====================  ====================
See dev-arrayapi for more information.
Examples
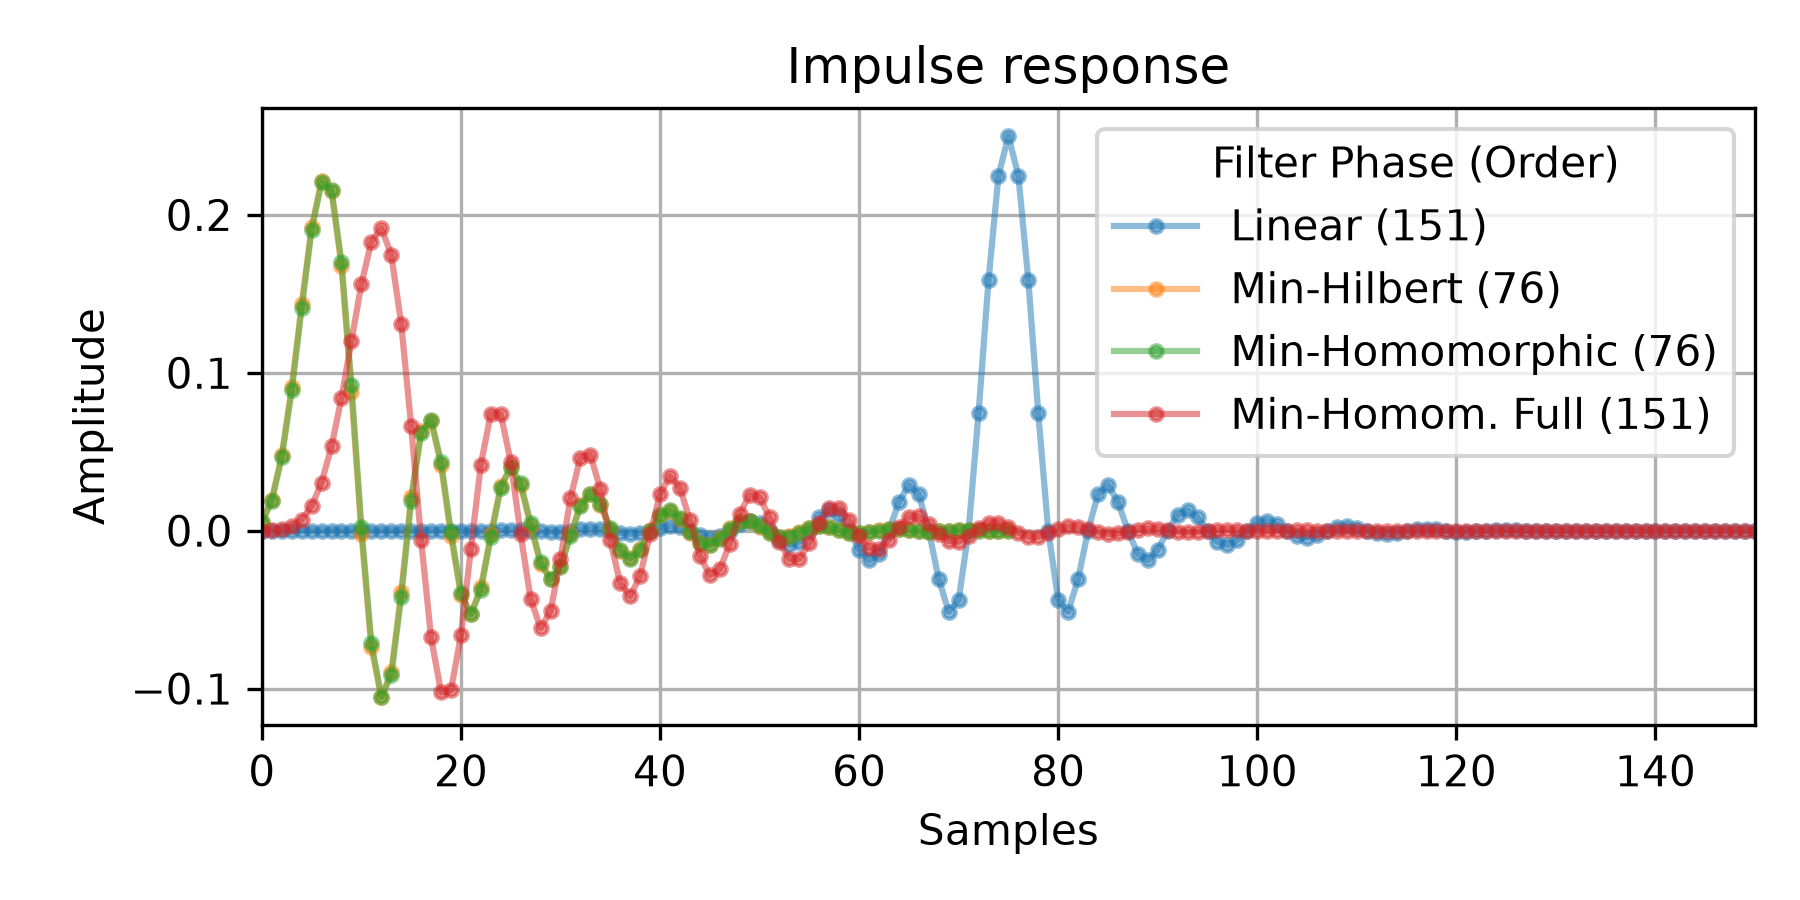
Create an optimal linear-phase low-pass filter `h` with a transition band of [0.2, 0.3] (assuming a Nyquist frequency of 1):import numpy as np from scipy.signal import remez, minimum_phase, freqz, group_delay import matplotlib.pyplot as plt freq = [0, 0.2, 0.3, 1.0] desired = [1, 0] h_linear = remez(151, freq, desired, fs=2)✓
h_hil = minimum_phase(h_linear, method='hilbert')
h_hom = minimum_phase(h_linear, method='homomorphic')
h_hom_full = minimum_phase(h_linear, method='homomorphic', half=False)
✓
fig0, ax0 = plt.subplots(figsize=(6, 3), tight_layout=True)
fig1, axs = plt.subplots(3, sharex='all', figsize=(6, 6), tight_layout=True)
✓
ax0.set_title("Impulse response")
ax0.set(xlabel='Samples', ylabel='Amplitude', xlim=(0, len(h_linear) - 1))
axs[0].set_title("Frequency Response")
axs[0].set(xlim=(0, .65), ylabel="Magnitude / dB")
axs[1].set(ylabel="Phase / rad")
axs[2].set(ylabel="Group Delay / samples", ylim=(-31, 81),
            xlabel='Normalized Frequency (Nyqist frequency: 1)')
for h, lb in ((h_linear,   f'Linear ({len(h_linear)})'),
              (h_hil,      f'Min-Hilbert ({len(h_hil)})'),
              (h_hom,      f'Min-Homomorphic ({len(h_hom)})'),
              (h_hom_full, f'Min-Homom. Full ({len(h_hom_full)})')):
    w_H, H = freqz(h, fs=2)
    w_gd, gd = group_delay((h, 1), fs=2)

    alpha = 1.0 if lb == 'linear' else 0.5  # full opacity for 'linear' line
    ax0.plot(h, '.-', alpha=alpha, label=lb)
    axs[0].plot(w_H, 20 * np.log10(np.abs(H)), alpha=alpha)
    axs[1].plot(w_H, np.unwrap(np.angle(H)), alpha=alpha, label=lb)
    axs[2].plot(w_gd, gd, alpha=alpha)
✗
[<matplotlib.lines.Line2D object at 0x7fa8e7e04830>]
[<matplotlib.lines.Line2D object at 0x7fa8e7e04980>]
[<matplotlib.lines.Line2D object at 0x7fa8e7e04d70>]
[<matplotlib.lines.Line2D object at 0x7fa8e7e067b0>]
[<matplotlib.lines.Line2D object at 0x7fa8e7e06900>]
[<matplotlib.lines.Line2D object at 0x7fa8e7e06120>]
[<matplotlib.lines.Line2D object at 0x7fa8e7e04590>]
[<matplotlib.lines.Line2D object at 0x7fa8e7e05fd0>]
[<matplotlib.lines.Line2D object at 0x7fa8e7e06a50>]
[<matplotlib.lines.Line2D object at 0x7fa8e7e042f0>]
[<matplotlib.lines.Line2D object at 0x7fa8e7e06f90>]
[<matplotlib.lines.Line2D object at 0x7fa8e7e06270>]
[<matplotlib.lines.Line2D object at 0x7fa8e7e05940>]
[<matplotlib.lines.Line2D object at 0x7fa8e7e057f0>]
[<matplotlib.lines.Line2D object at 0x7fa8e7e070e0>]
[<matplotlib.lines.Line2D object at 0x7fa8e7e05d30>]
ax0.grid(True)
✓ax0.legend(title='Filter Phase (Order)') axs[1].legend(title='Filter Phase (Order)', loc='lower right') for ax_ in axs: # shade transition band: ax_.axvspan(freq[1], freq[2], color='y', alpha=.25) ax_.grid(True)✗
<matplotlib.patches.Rectangle object at 0x7fa8f67dce10>
<matplotlib.patches.Rectangle object at 0x7fa8fc4fe210>
<matplotlib.patches.Rectangle object at 0x7fa8fc4fcb90>
plt.show()
✓
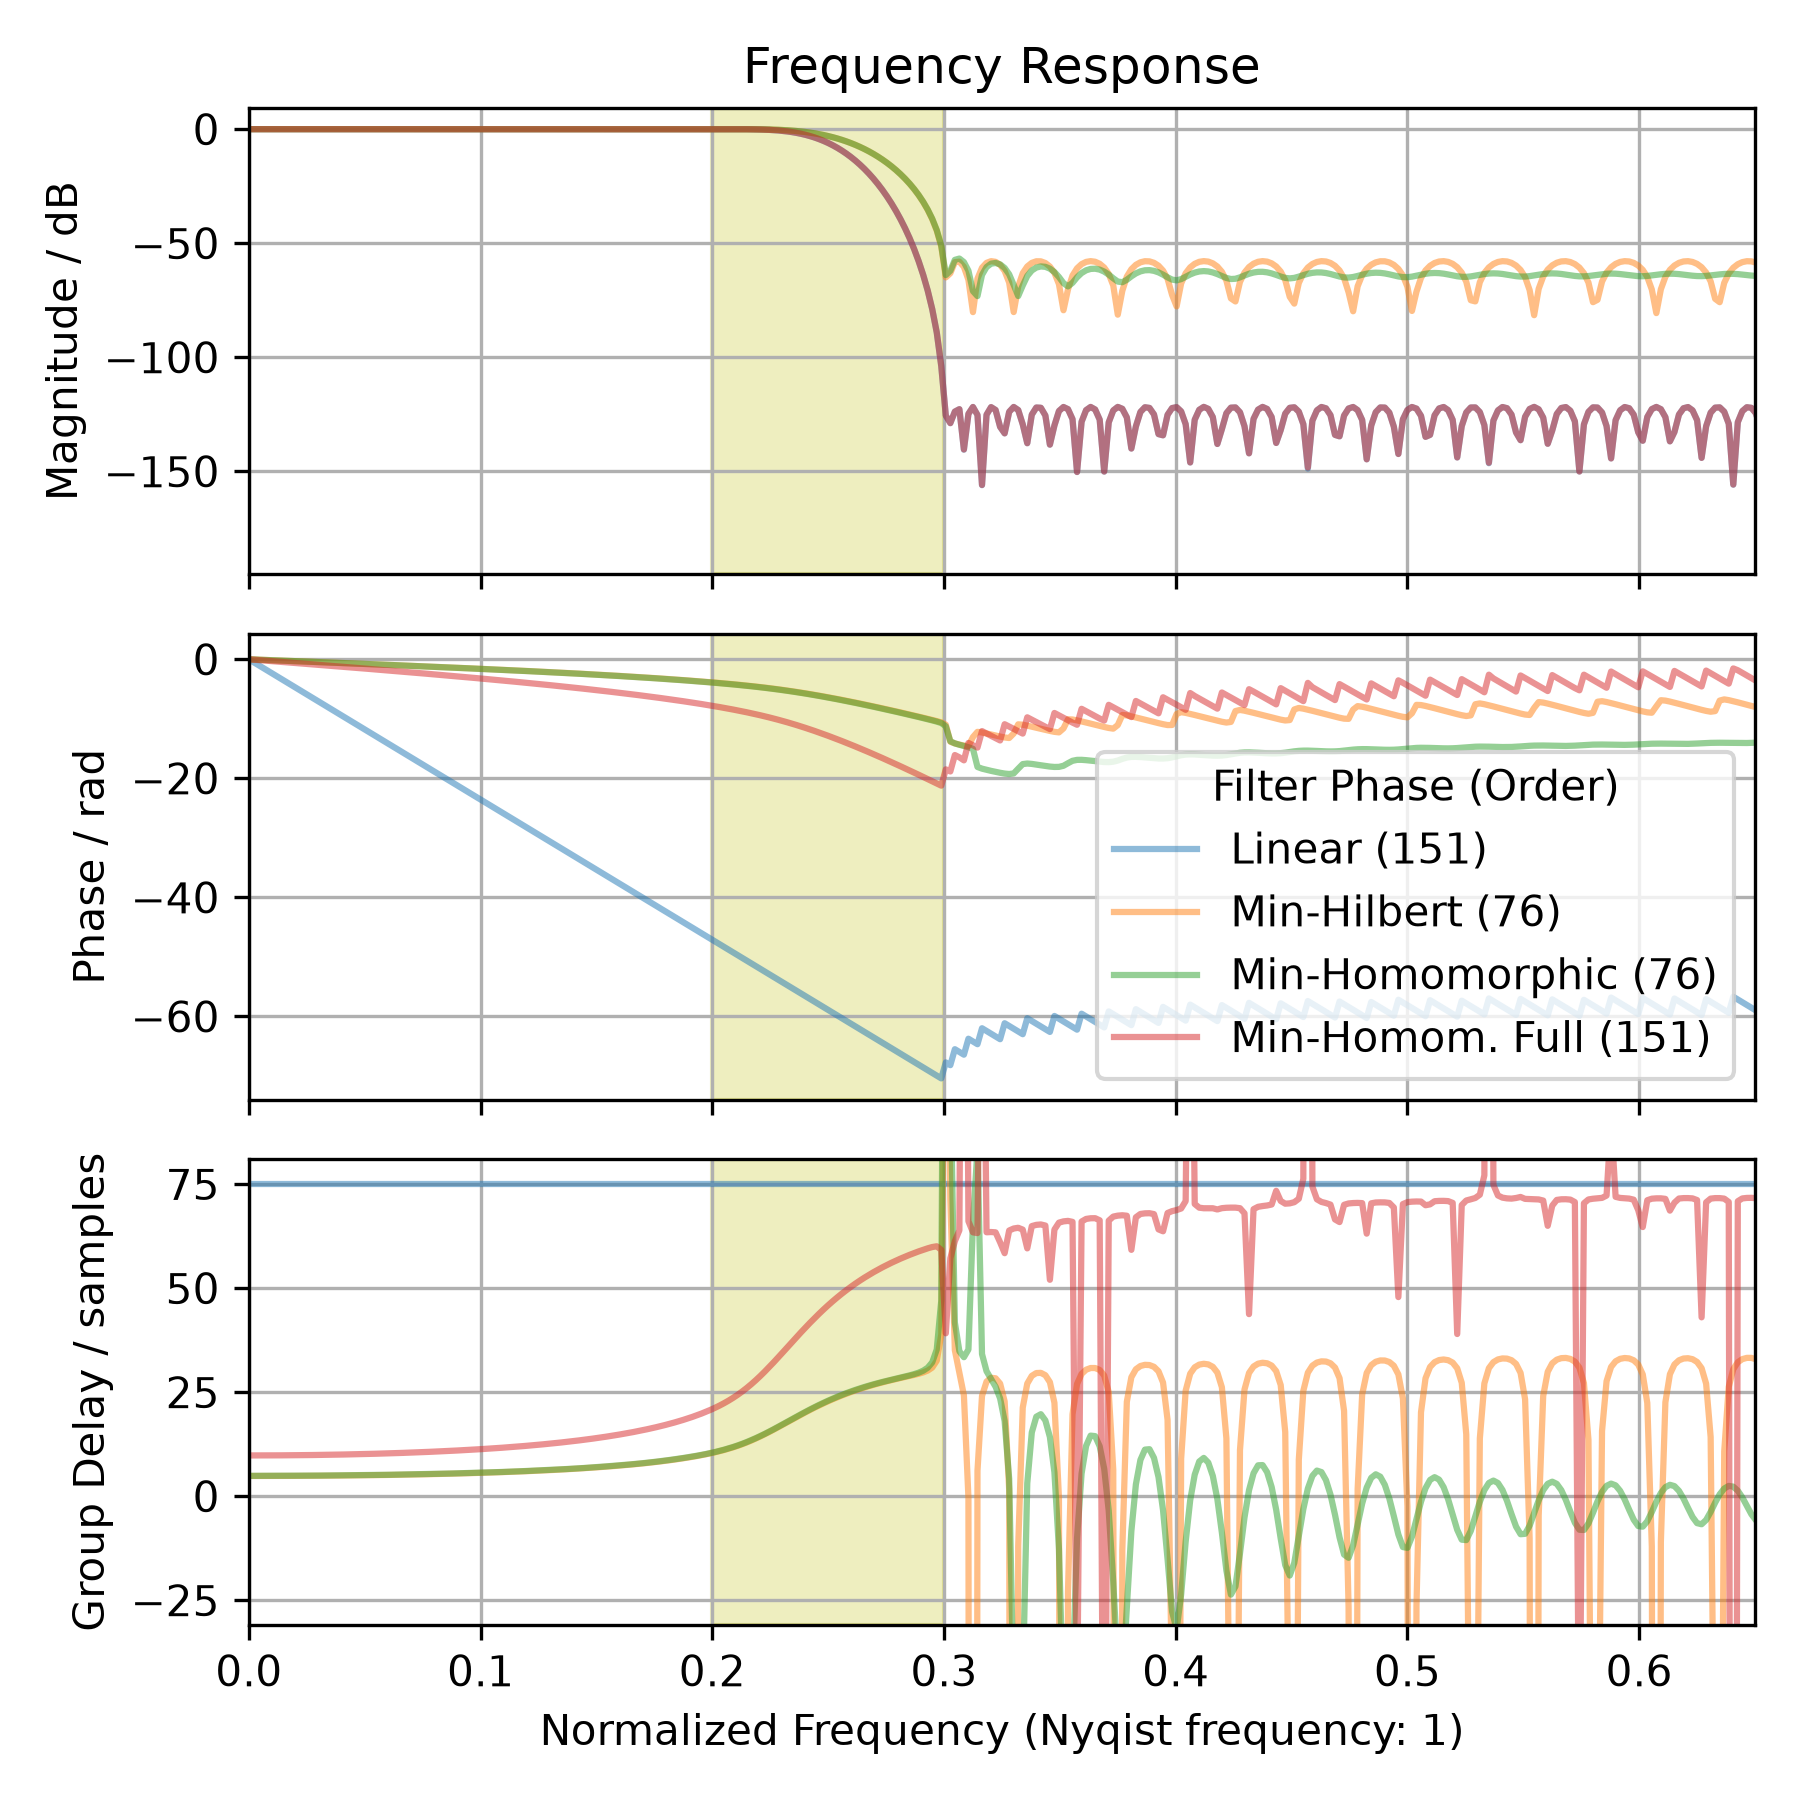
See also
Aliases
scipy.signal.minimum_phase