bundles / scipy 1.18.0 / scipy / signal / _ltisys / freqresp
function
scipy.signal._ltisys:freqresp
source: /scipy/signal/_ltisys.py:2513
Signature
def freqresp(system, w = None, n = 10000)Summary
Calculate the frequency response of a continuous-time system.
Parameters
system: an instance of the `lti` class or a tuple describing the systemThe following gives the number of elements in the tuple and the interpretation:
1 (instance of lti)
2 (num, den)
3 (zeros, poles, gain)
4 (A, B, C, D)
w: array_like, optionalArray of frequencies (in rad/s). Magnitude and phase data is calculated for every value in this array. If not given, a reasonable set will be calculated.
n: int, optionalNumber of frequency points to compute if
wis not given. Thenfrequencies are logarithmically spaced in an interval chosen to include the influence of the poles and zeros of the system.
Returns
w: 1D ndarrayFrequency array [rad/s]
H: 1D ndarrayArray of complex magnitude values
Notes
If (num, den) is passed in for system, coefficients for both the numerator and denominator should be specified in descending exponent order (e.g. s^2 + 3s + 5 would be represented as [1, 3, 5]).
Examples
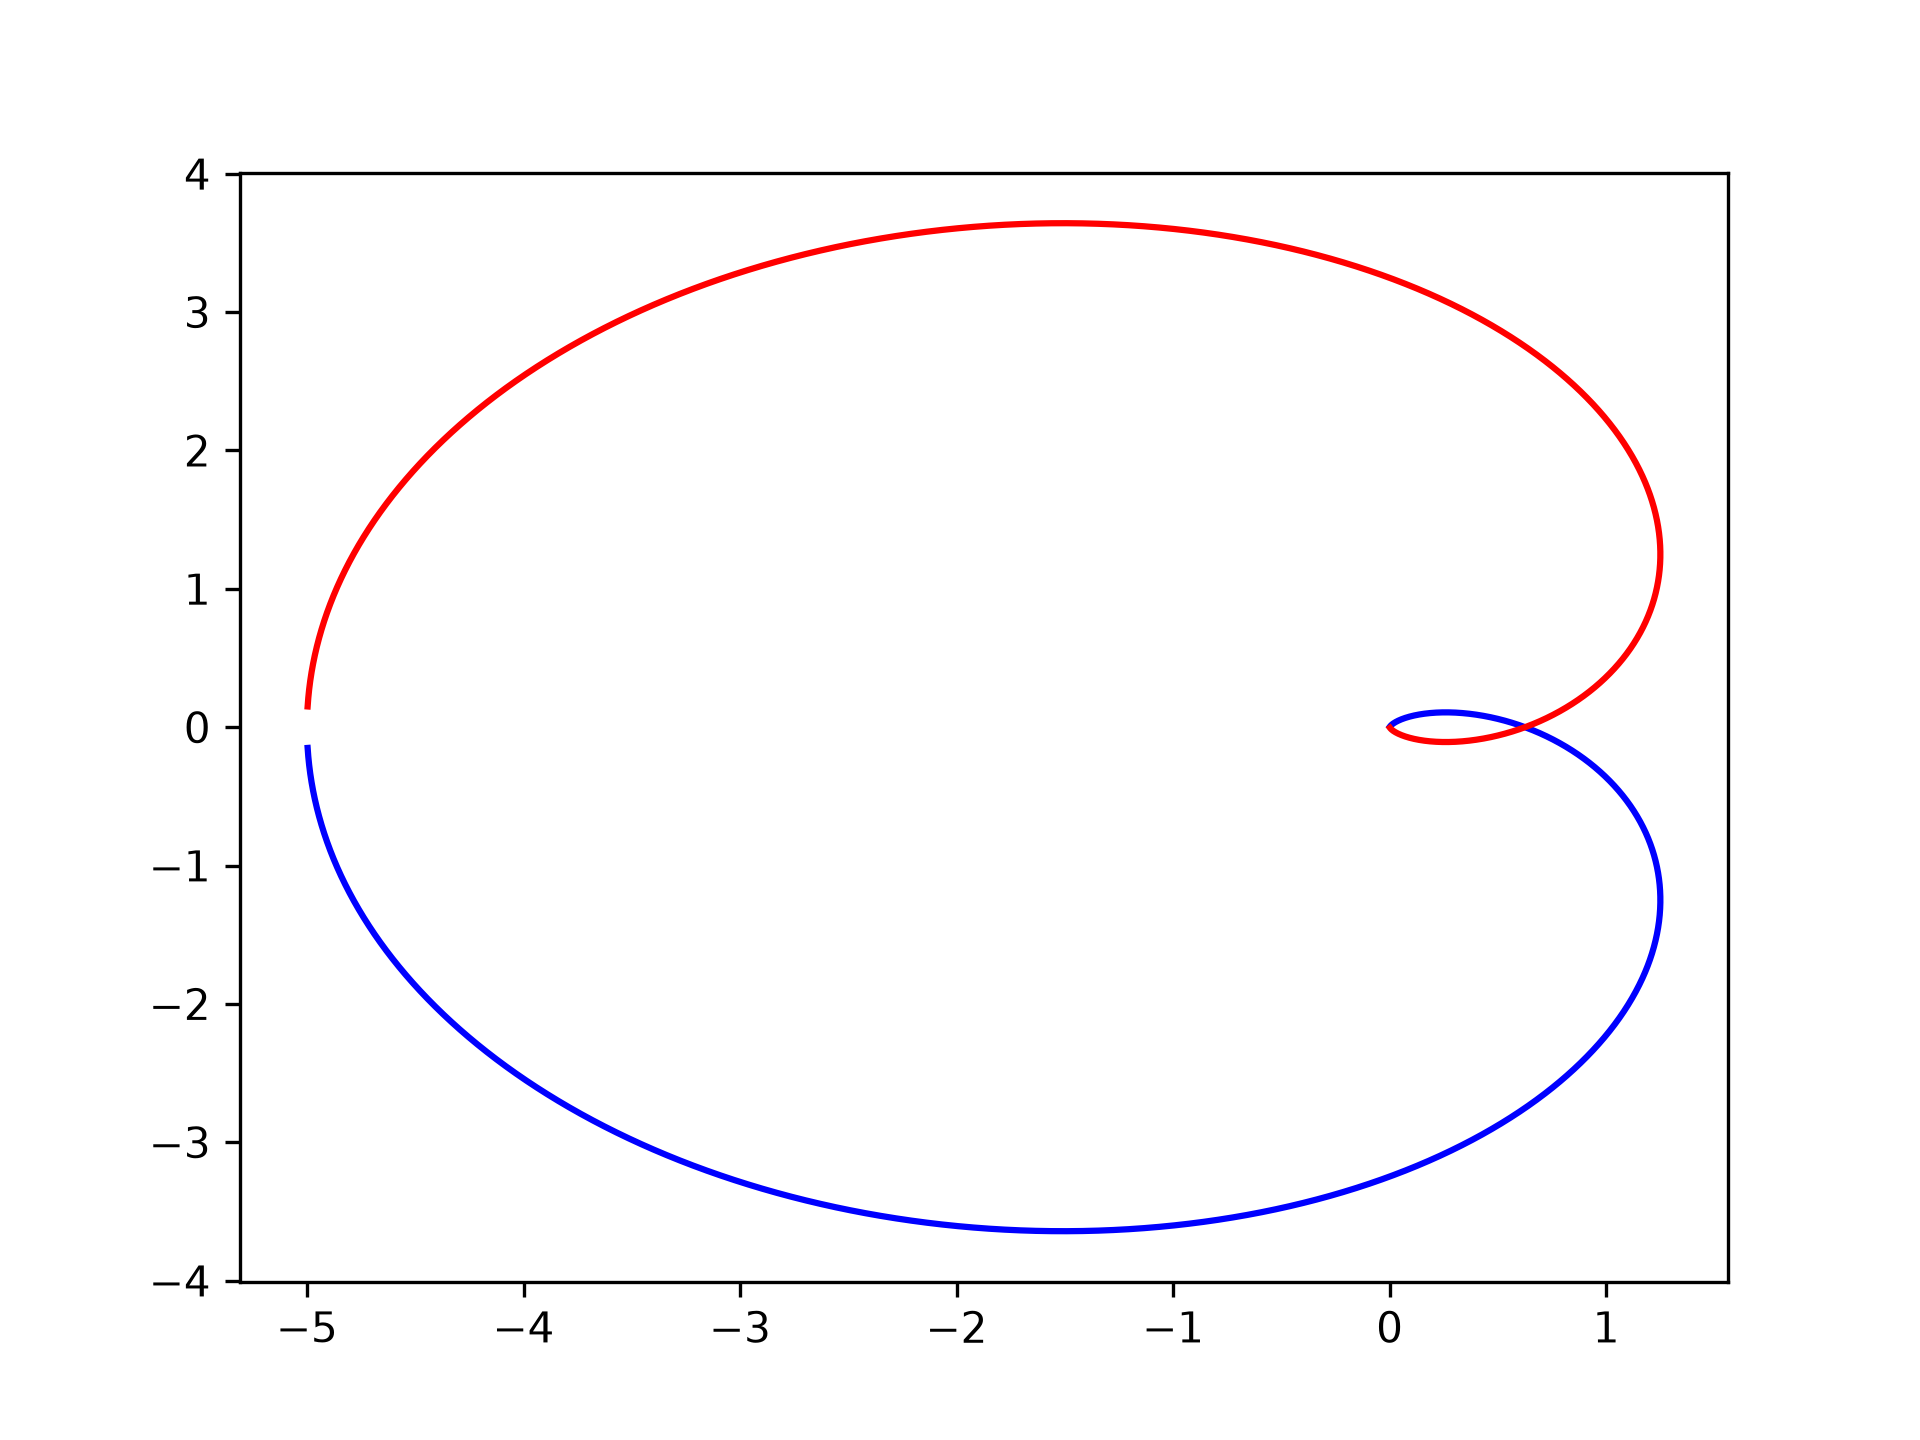
Generating the Nyquist plot of a transfer functionfrom scipy import signal import matplotlib.pyplot as plt✓
s1 = signal.ZerosPolesGain([], [1, 1, 1], [5])
✓w, H = signal.freqresp(s1)
✓plt.figure() plt.plot(H.real, H.imag, "b") plt.plot(H.real, -H.imag, "r")✗
[<matplotlib.lines.Line2D object at 0x7fa8f674c6e0>]
plt.show()
✓
Aliases
scipy.signal.freqresp