bundles / scipy 1.18.0 / scipy / signal / _max_len_seq / max_len_seq
function
scipy.signal._max_len_seq:max_len_seq
source: /scipy/signal/_max_len_seq.py:22
Signature
def max_len_seq(nbits, state = None, length = None, taps = None)Summary
Maximum length sequence (MLS) generator.
Parameters
nbits: intNumber of bits to use. Length of the resulting sequence will be
(2**nbits) - 1. Note that generating long sequences (e.g., greater thannbits == 16) can take a long time.state: array_like, optionalIf array, must be of length
nbits, and will be cast to binary (bool) representation. If None, a seed of ones will be used, producing a repeatable representation. Ifstateis all zeros, an error is raised as this is invalid. Default: None.length: int, optionalNumber of samples to compute. If None, the entire length
(2**nbits) - 1is computed.taps: array_like, optionalPolynomial taps to use (e.g.,
[7, 6, 1]for an 8-bit sequence). If None, taps will be automatically selected (for up tonbits == 32).
Returns
seq: arrayResulting MLS sequence of 0's and 1's.
state: arrayThe final state of the shift register.
Notes
The algorithm for MLS generation is generically described in:
https://en.wikipedia.org/wiki/Maximum_length_sequence
The default values for taps are specifically taken from the first option listed for each value of nbits in:
https://web.archive.org/web/20181001062252/http://www.newwaveinstruments.com/resources/articles/m_sequence_linear_feedback_shift_register_lfsr.htm
Examples
MLS uses binary convention:from scipy.signal import max_len_seq max_len_seq(4)[0]✓
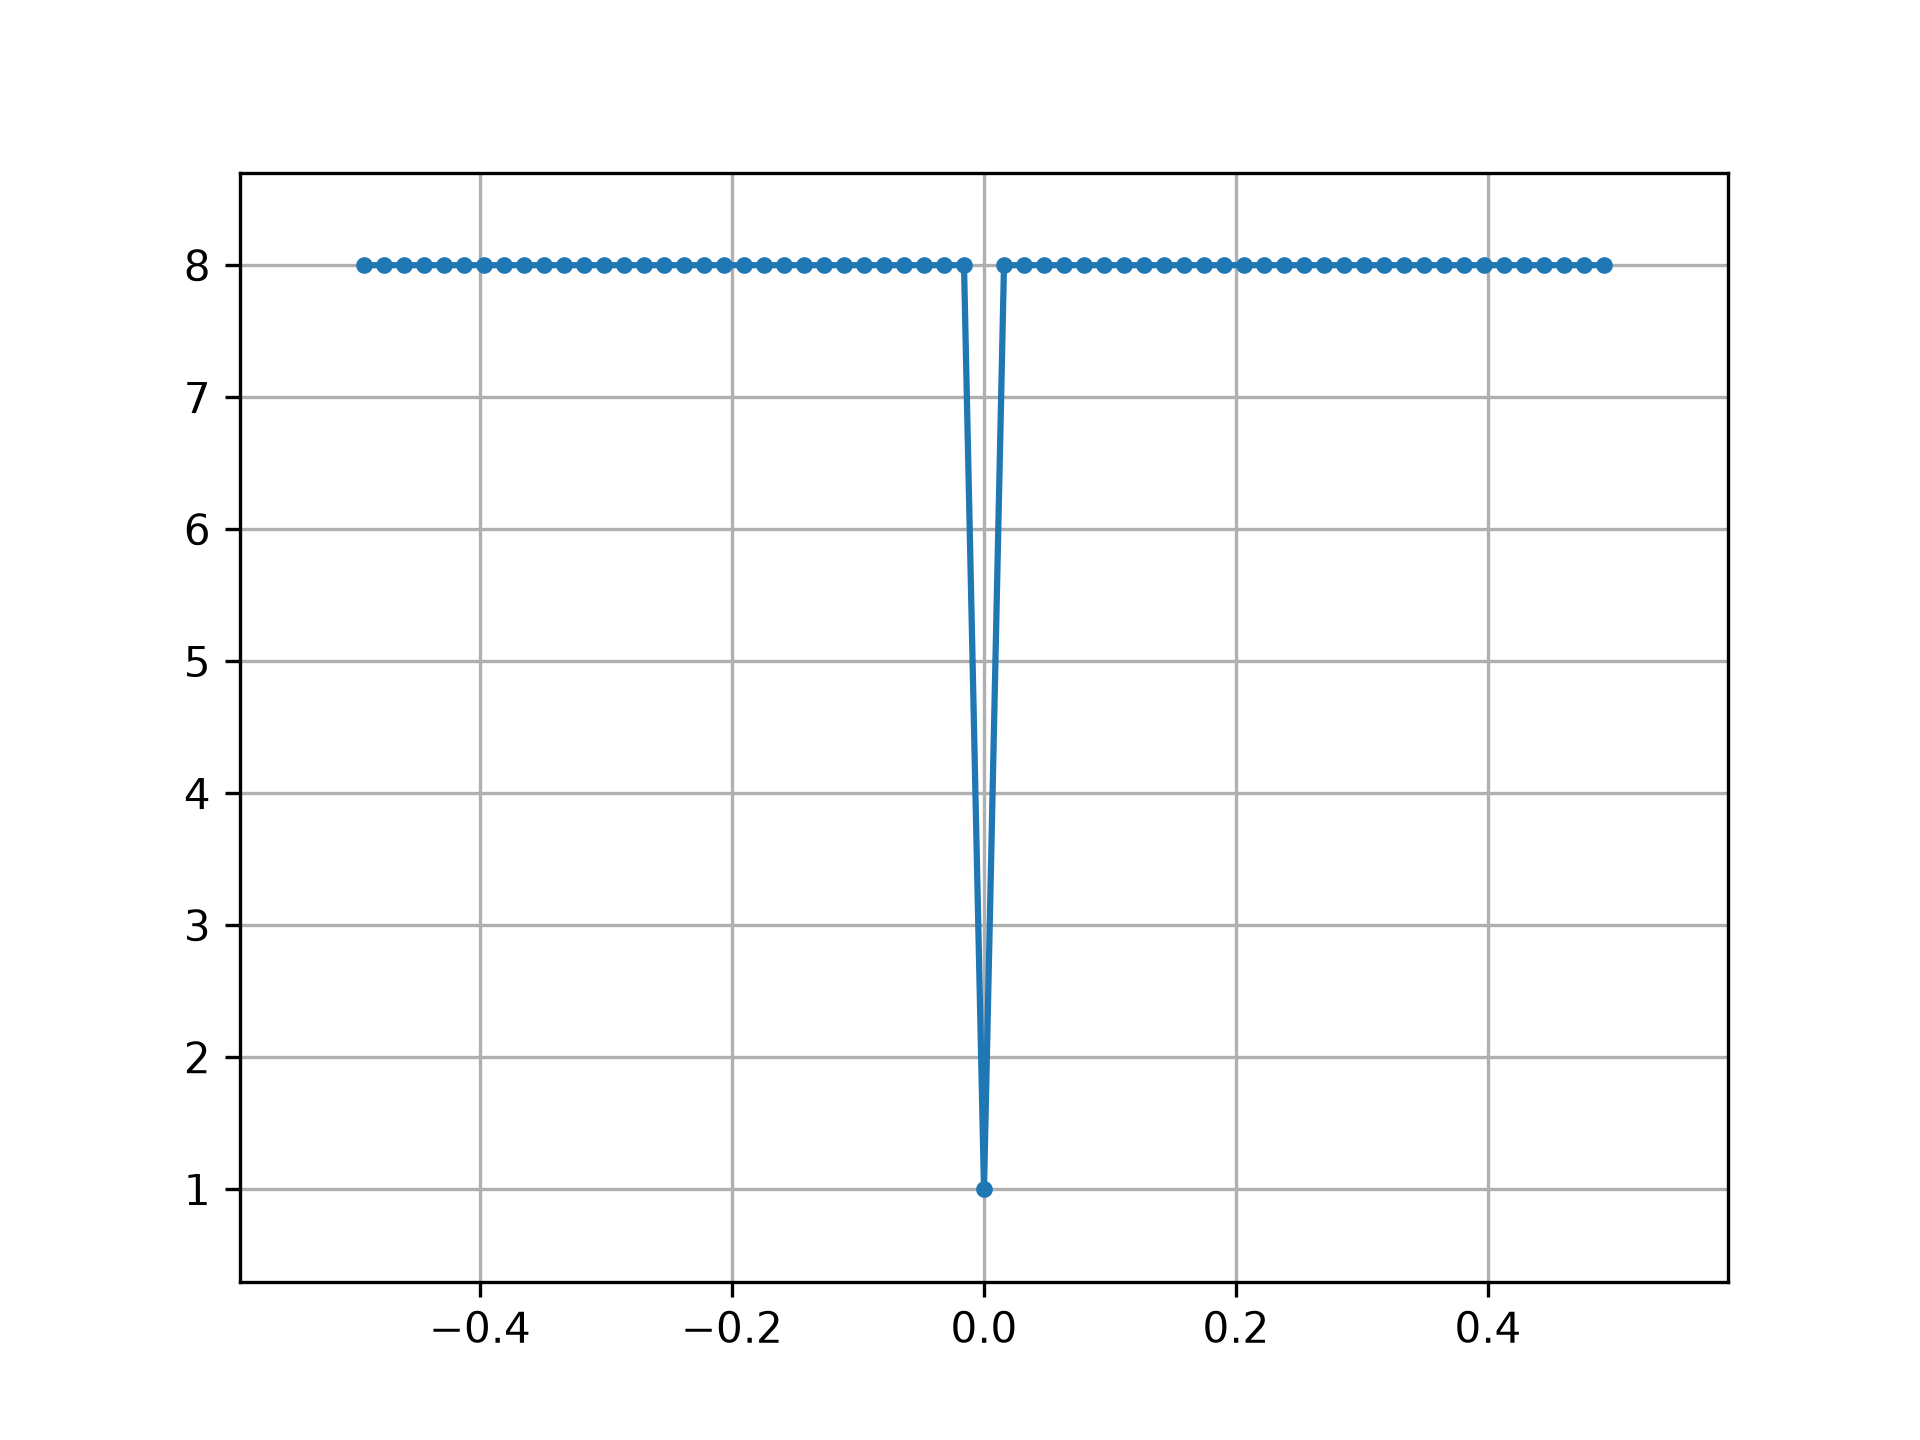
array([1, 1, 1, 1, 0, 1, 0, 1, 1, 0, 0, 1, 0, 0, 0], dtype=int8)MLS has a white spectrum (except for DC):
import numpy as np
import matplotlib.pyplot as plt
from numpy.fft import fft, ifft, fftshift, fftfreq
seq = max_len_seq(6)[0]*2-1  # +1 and -1
spec = fft(seq)
N = len(seq)
✓
plt.plot(fftshift(fftfreq(N)), fftshift(np.abs(spec)), '.-')
✗[<matplotlib.lines.Line2D object at 0x7fa8f406eba0>]
plt.margins(0.1, 0.1)
plt.grid(True)
plt.show()
✓
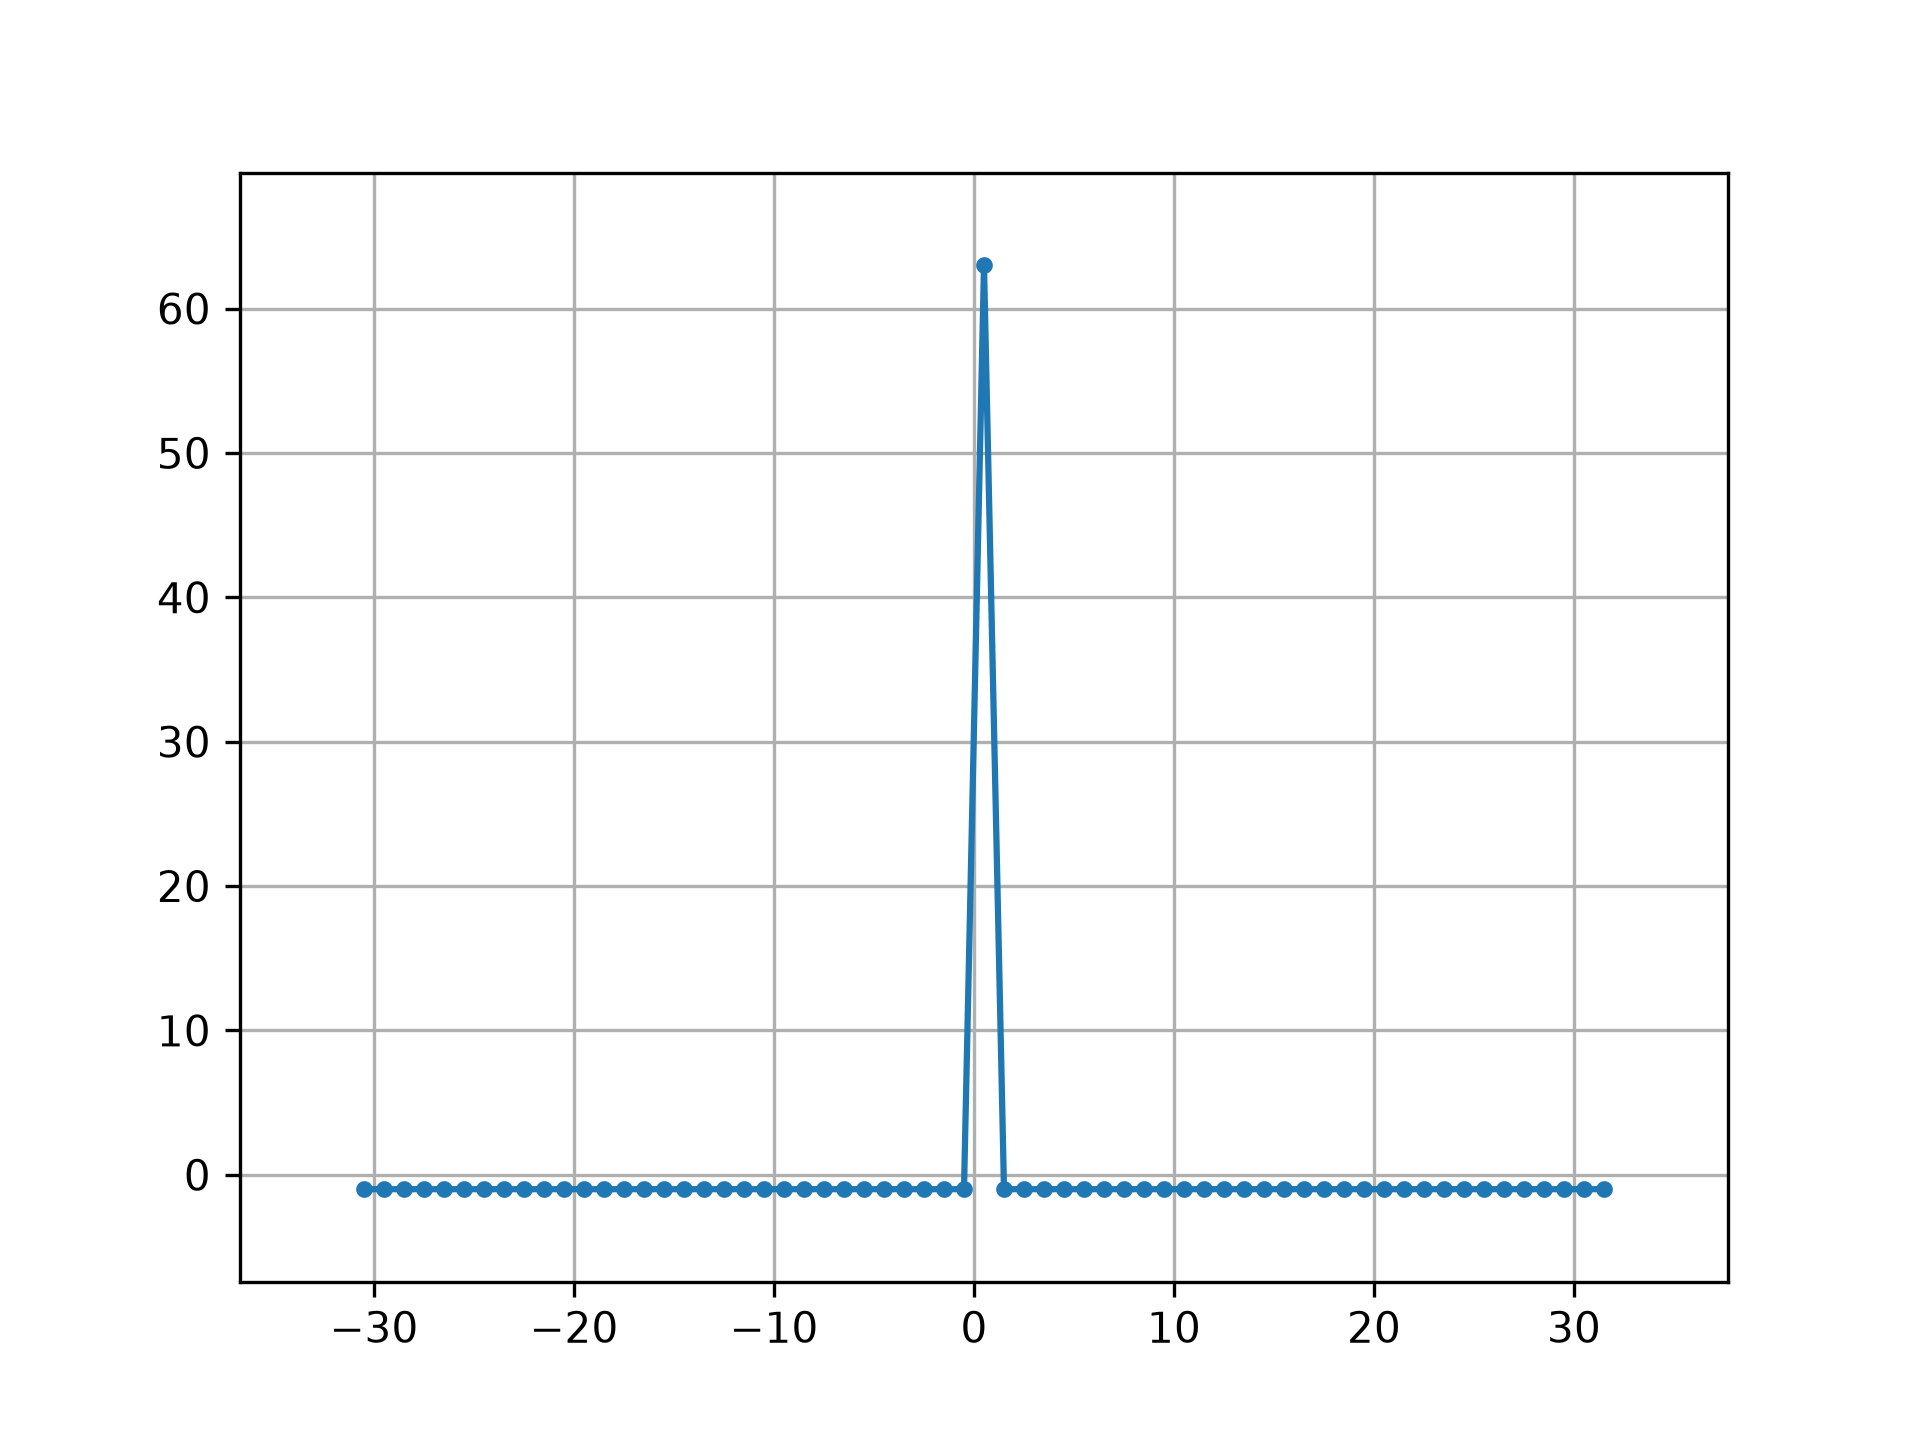
acorrcirc = ifft(spec * np.conj(spec)).real
✓plt.figure() plt.plot(np.arange(-N/2+1, N/2+1), fftshift(acorrcirc), '.-')✗
[<matplotlib.lines.Line2D object at 0x7fa8f406d6a0>]
plt.margins(0.1, 0.1)
plt.grid(True)
plt.show()
✓
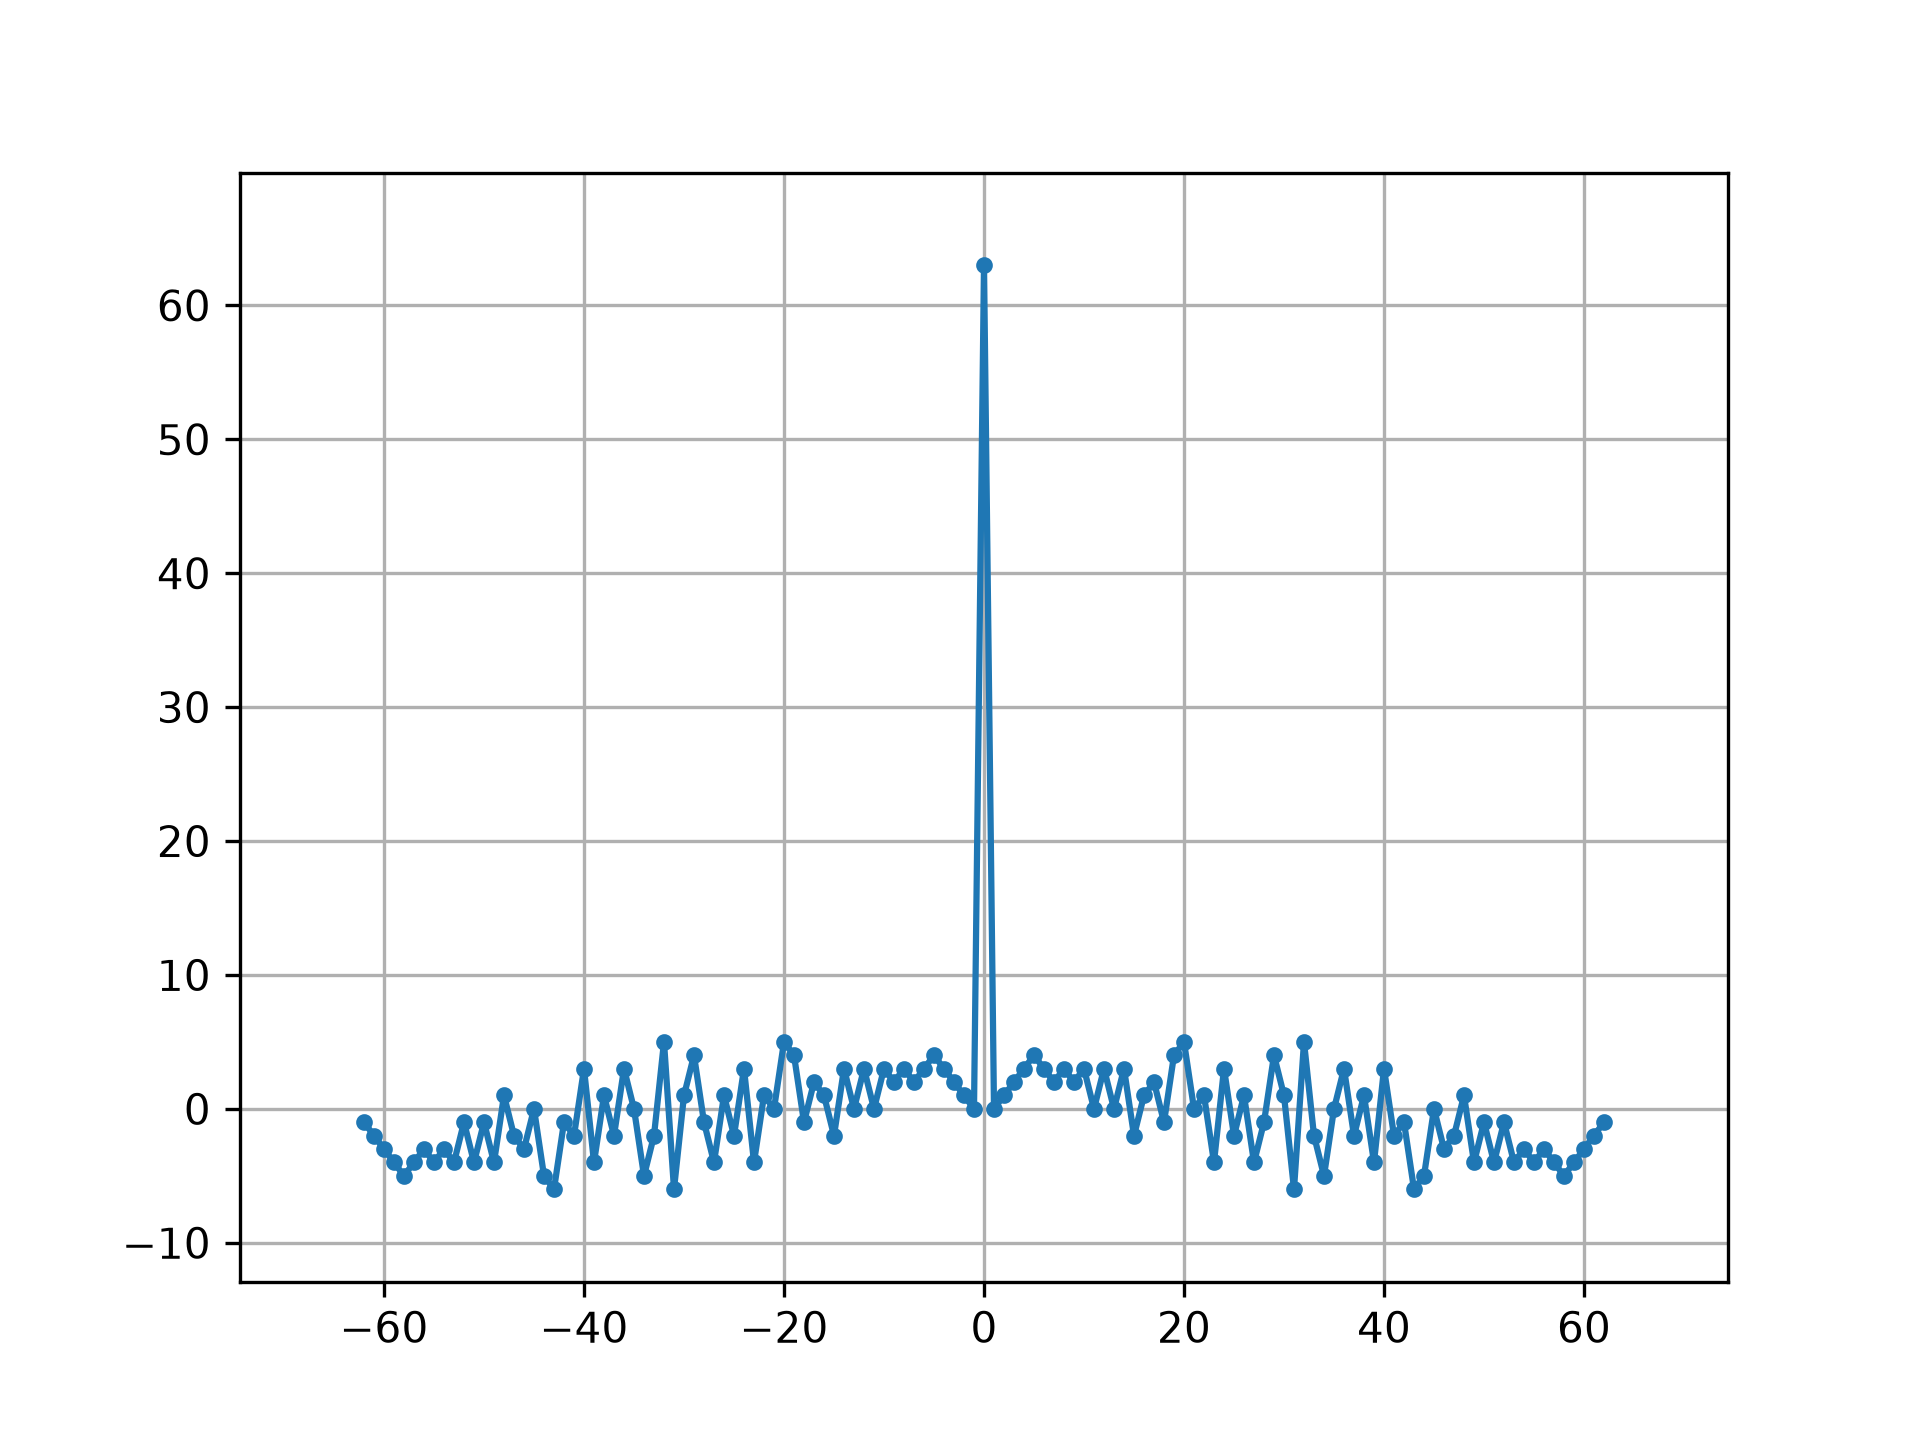
acorr = np.correlate(seq, seq, 'full')
✓plt.figure() plt.plot(np.arange(-N+1, N), acorr, '.-')✗
[<matplotlib.lines.Line2D object at 0x7fa8fe7ebe00>]
plt.margins(0.1, 0.1)
plt.grid(True)
plt.show()
✓
Aliases
scipy.signal.max_len_seq