bundles / scipy 1.18.0 / scipy / signal / _spectral_py / periodogram
function
scipy.signal._spectral_py:periodogram
Signature
def periodogram(x, fs = 1.0, window = boxcar, nfft = None, detrend = constant, return_onesided = True, scaling = density, axis = -1)Summary
Estimate power spectral density using a periodogram.
Parameters
x: array_likeTime series of measurement values
fs: float, optionalSampling frequency of the
xtime series. Defaults to 1.0.window: str or tuple or array_like, optionalDesired window to use. If
windowis a string or tuple, it is passed to get_window to generate the window values, which are DFT-even by default. See get_window for a list of windows and required parameters. Ifwindowis array_like it will be used directly as the window and its length must be equal to the length of the axis over which the periodogram is computed. Defaults to 'boxcar'.nfft: int, optionalLength of the FFT used. If None the length of
xwill be used.detrend: str or function or `False`, optionalSpecifies how to detrend each segment. If
detrendis a string, it is passed as the type argument to thedetrendfunction. If it is a function, it takes a segment and returns a detrended segment. Ifdetrendis False, no detrending is done. Defaults to 'constant'.return_onesided: bool, optionalIf True, return a one-sided spectrum for real data. If False return a two-sided spectrum. Defaults to True, but for complex data, a two-sided spectrum is always returned.
scaling: { 'density', 'spectrum' }, optionalSelects between computing the power spectral density ('density') where Pxx has units of V²/Hz and computing the squared magnitude spectrum ('spectrum') where Pxx has units of V², if
xis measured in V andfsis measured in Hz. Defaults to 'density'axis: int, optionalAxis along which the periodogram is computed; the default is over the last axis (i.e.
axis=-1).
Returns
f: ndarrayArray of sample frequencies.
Pxx: ndarrayPower spectral density or power spectrum of
x.
Notes
The ratio of the squared magnitude (scaling='spectrum') divided by the spectral power density (scaling='density') is the constant factor of sum(abs(window)**2)*fs / abs(sum(window))**2. If return_onesided is True, the values of the negative frequencies are added to values of the corresponding positive ones.
Consult the tutorial_SpectralAnalysis section of the user_guide for a discussion of the scalings of the power spectral density and the magnitude (squared) spectrum.
Examples
import numpy as np
from scipy import signal
import matplotlib.pyplot as plt
rng = np.random.default_rng()
✓
fs = 10e3
N = 1e5
amp = 2*np.sqrt(2)
freq = 1234.0
noise_power = 0.001 * fs / 2
time = np.arange(N) / fs
x = amp*np.sin(2*np.pi*freq*time)
x += rng.normal(scale=np.sqrt(noise_power), size=time.shape)
✓
f, Pxx_den = signal.periodogram(x, fs)
✓plt.semilogy(f, Pxx_den) plt.ylim([1e-7, 1e2]) plt.xlabel('frequency [Hz]') plt.ylabel('PSD [V**2/Hz]')✗
Text(0, 0.5, 'PSD [V**2/Hz]')
plt.show()
✓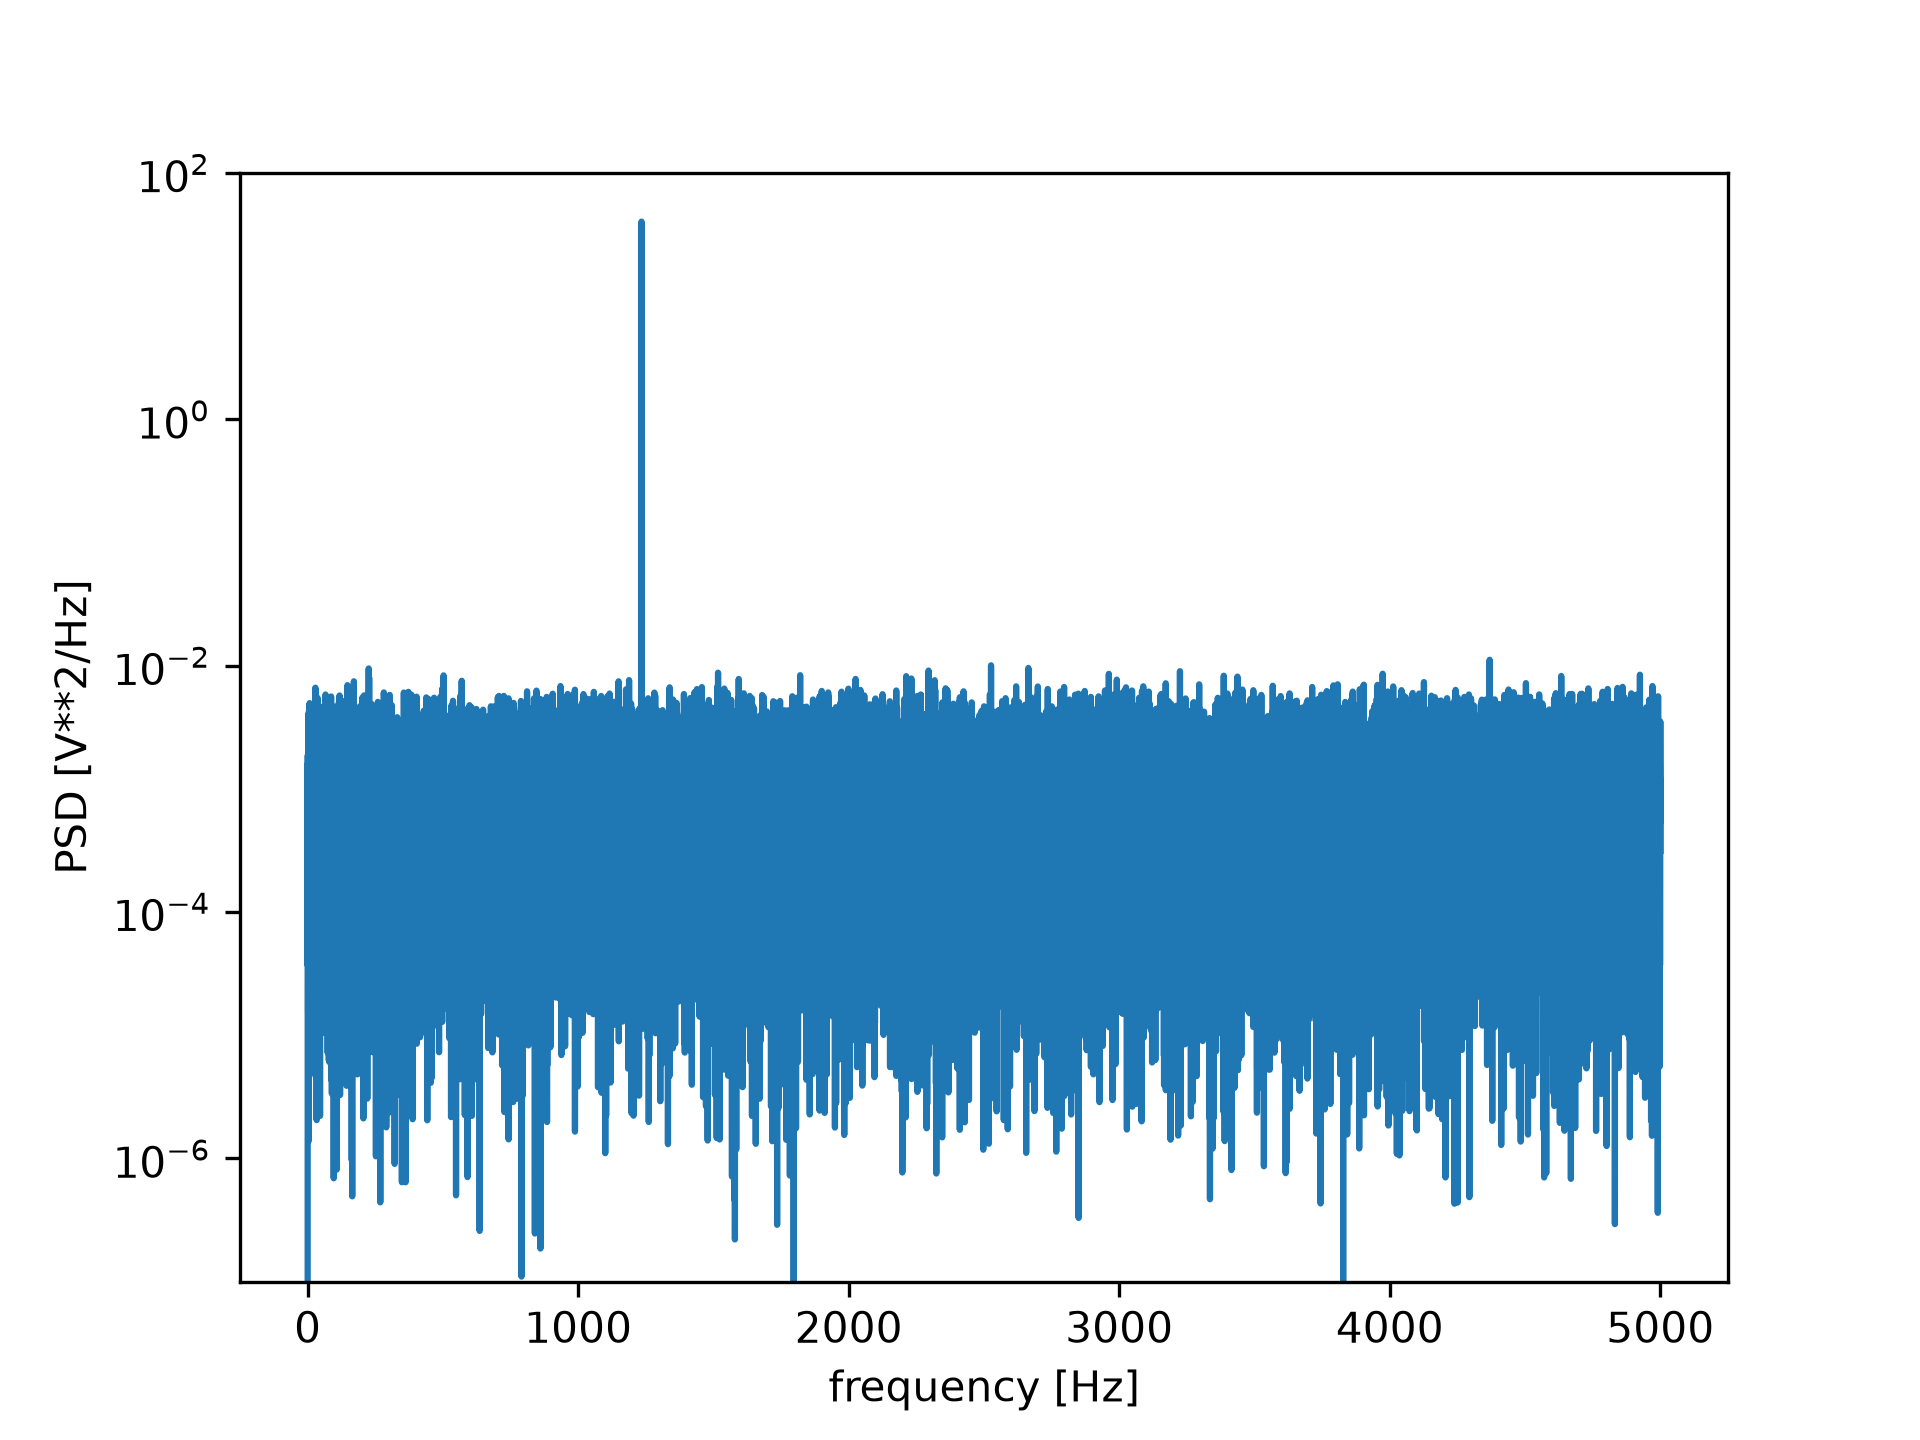
np.mean(Pxx_den[25000:])
✗np.float64(0.001007816358315675)Now compute and plot the power spectrum.
f, Pxx_spec = signal.periodogram(x, fs, 'flattop', scaling='spectrum')
✓plt.figure() plt.semilogy(f, np.sqrt(Pxx_spec)) plt.ylim([1e-4, 1e1]) plt.xlabel('frequency [Hz]') plt.ylabel('Linear spectrum [V RMS]')✗
Text(0, 0.5, 'Linear spectrum [V RMS]')
plt.show()
✓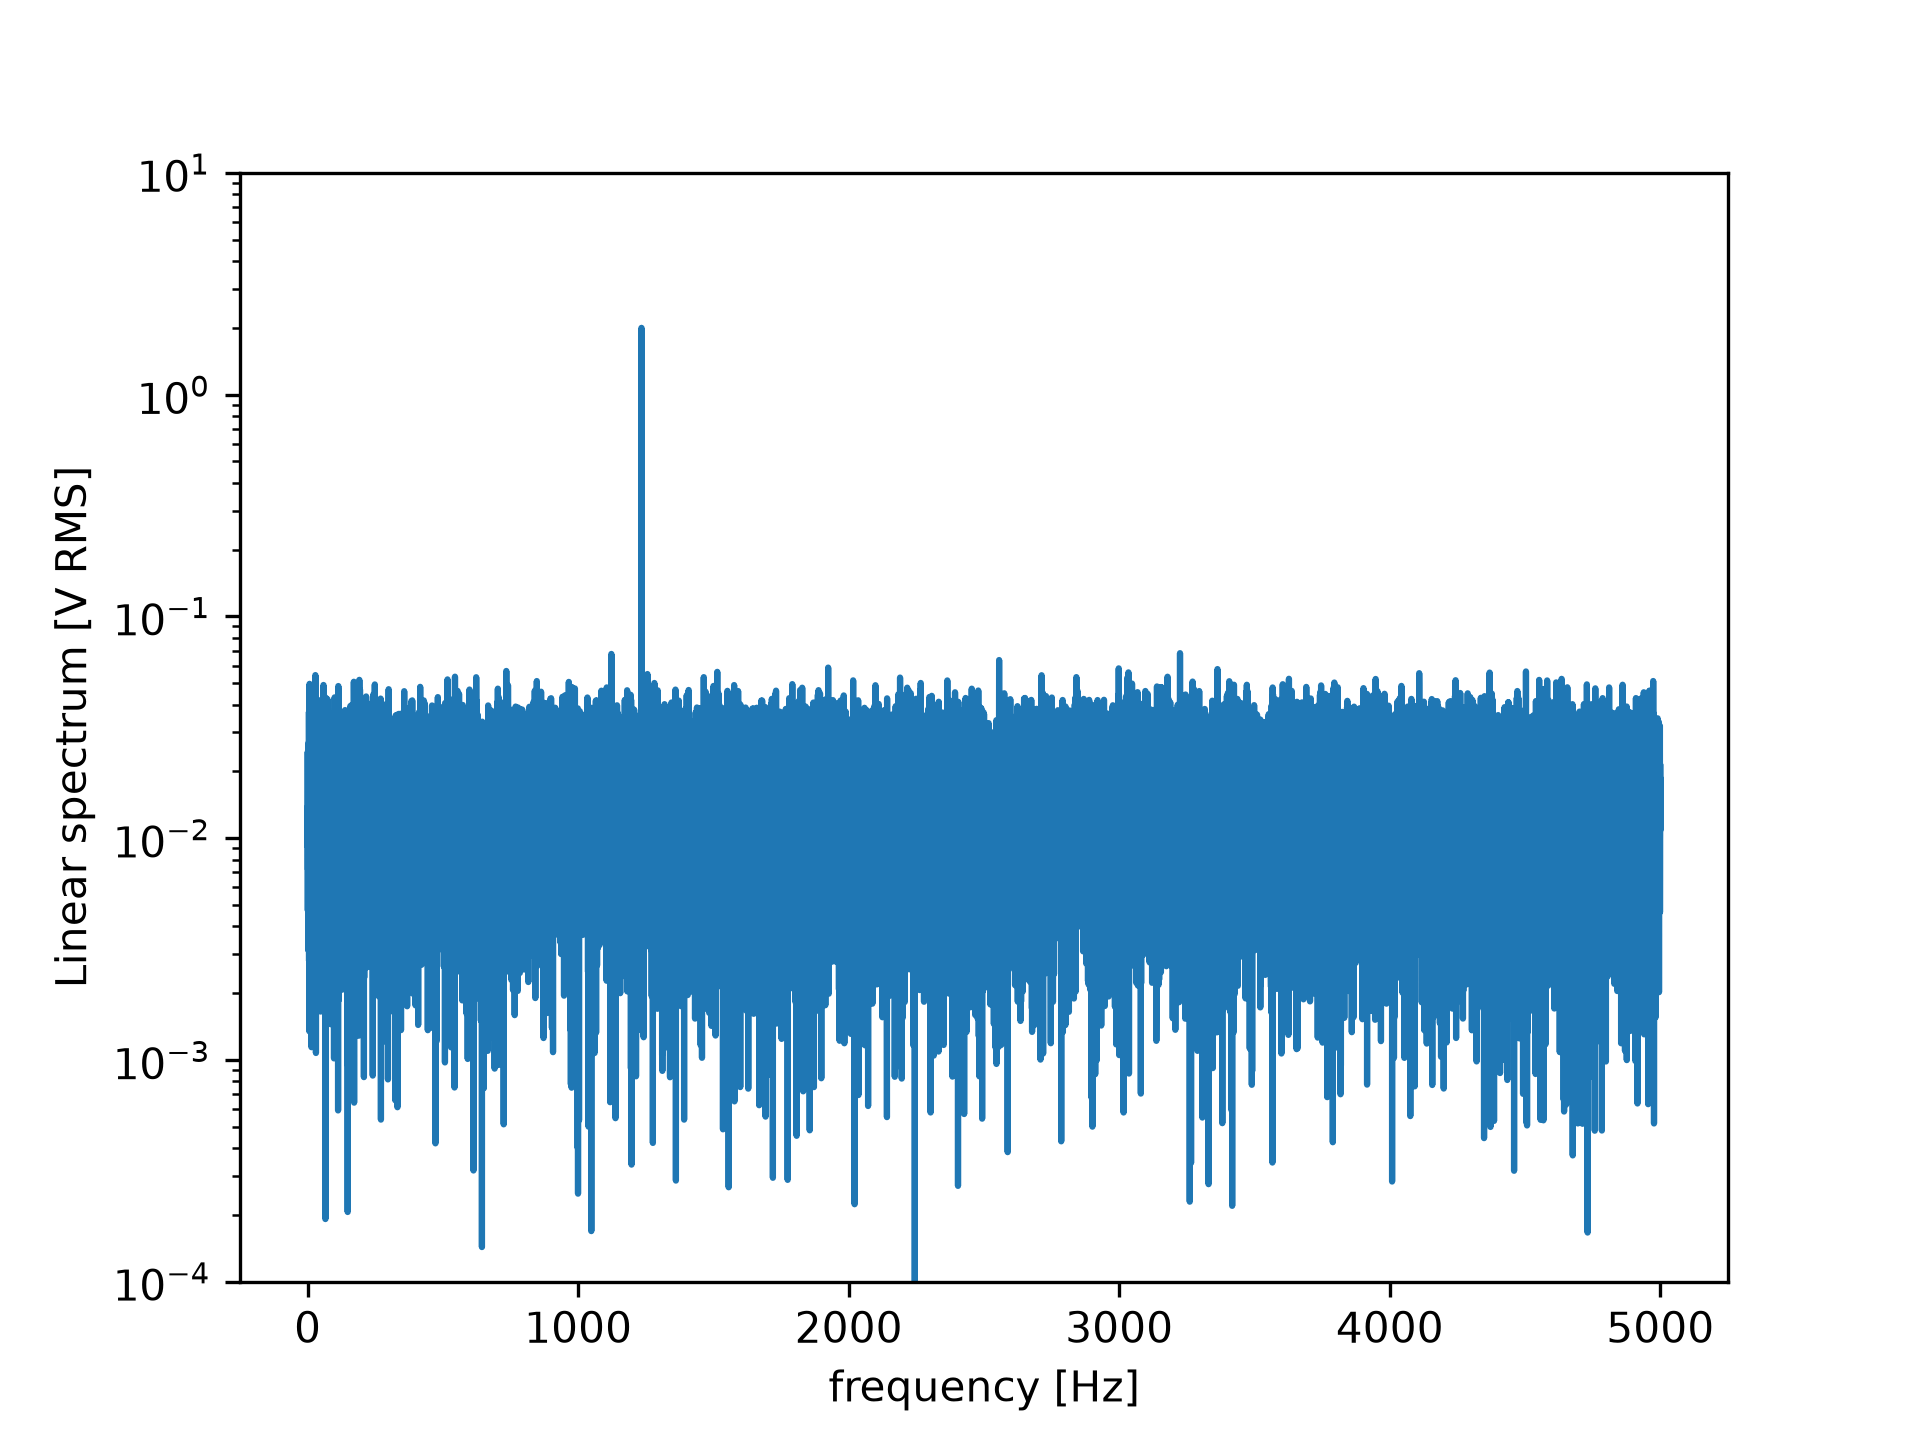
np.sqrt(Pxx_spec.max())
✗np.float64(1.999065127333741)
See also
- lombscargle
Lomb-Scargle periodogram for unevenly sampled data
- welch
Estimate power spectral density using Welch's method
Aliases
scipy.signal.periodogram