bundles / scipy 1.18.0 / scipy / signal / _whittaker / whittaker_henderson
function
scipy.signal._whittaker:whittaker_henderson
source: /scipy/signal/_whittaker.py:67
Signature
def whittaker_henderson(signal, *, lamb = reml, order = 2, weights = None)Summary
Whittaker-Henderson (WH) smoothing/graduation of a discrete signal.
Extended Summary
This implements WH smoothing with a difference penalty of the specified order and penalty strength lamb, see [1], [2] and [3]. WH can be seen as a penalized B-Spline (P-Spline) of degree zero for equidistant knots at the signal positions.
In econometrics, the WH graduation of order 2 is referred to as the Hodrick-Prescott filter [4].
Parameters
signal: array_likeA one-dimensional array of length
order + 1representing equidistant data points of a signal, e.g. a time series with constant time lag.lamb: str or float, optionalSmoothing or penalty parameter, default is
"reml"which minimizes the restricted maximum likelihood (REML) criterion to find the parameterlamb. If a number is passed, it must be non-negative and it is used directly.order: int, default: 2The order of the difference penalty, must be at least 1.
weights: array_like or None, optionalA one-dimensional array of case weights with the same length as
signal.Noneis equivalent to an array of all ones,np.ones_like(signal).
Returns
res: _RichResultAn object similar to an instance of scipy.optimize.OptimizeResult with the following attributes:
x
The WH smoothed signal.
lamb
The penalty parameter. If the input
lambis a number, this value is returned. If the input was"reml", the penalty parameter that minimized the REML criterion is returned.
Notes
For the signal and weights , WH of order with smoothing or penalty parameter solves the following optimization problem for :
where is the forward difference operator of order , and . For every input value , it generates a smoothed value .
One of the nice properties of WH is that it automatically performs inter- and extrapolation of data. Interpolation means filling in values when signal data is only available on the left and on the right. Extrapolation means filling in values after the observed signal ends. Set weights = 0 for regions where you want to extra- or interpolate. The values of signal don't matter if weights = 0. WH interpolates a polynomial of degree = 2 * order - 1 and it extrapolates a polynomial of degree = order - 1. For order = 2, this means cubic interpolation and linear extrapolation.
Examples
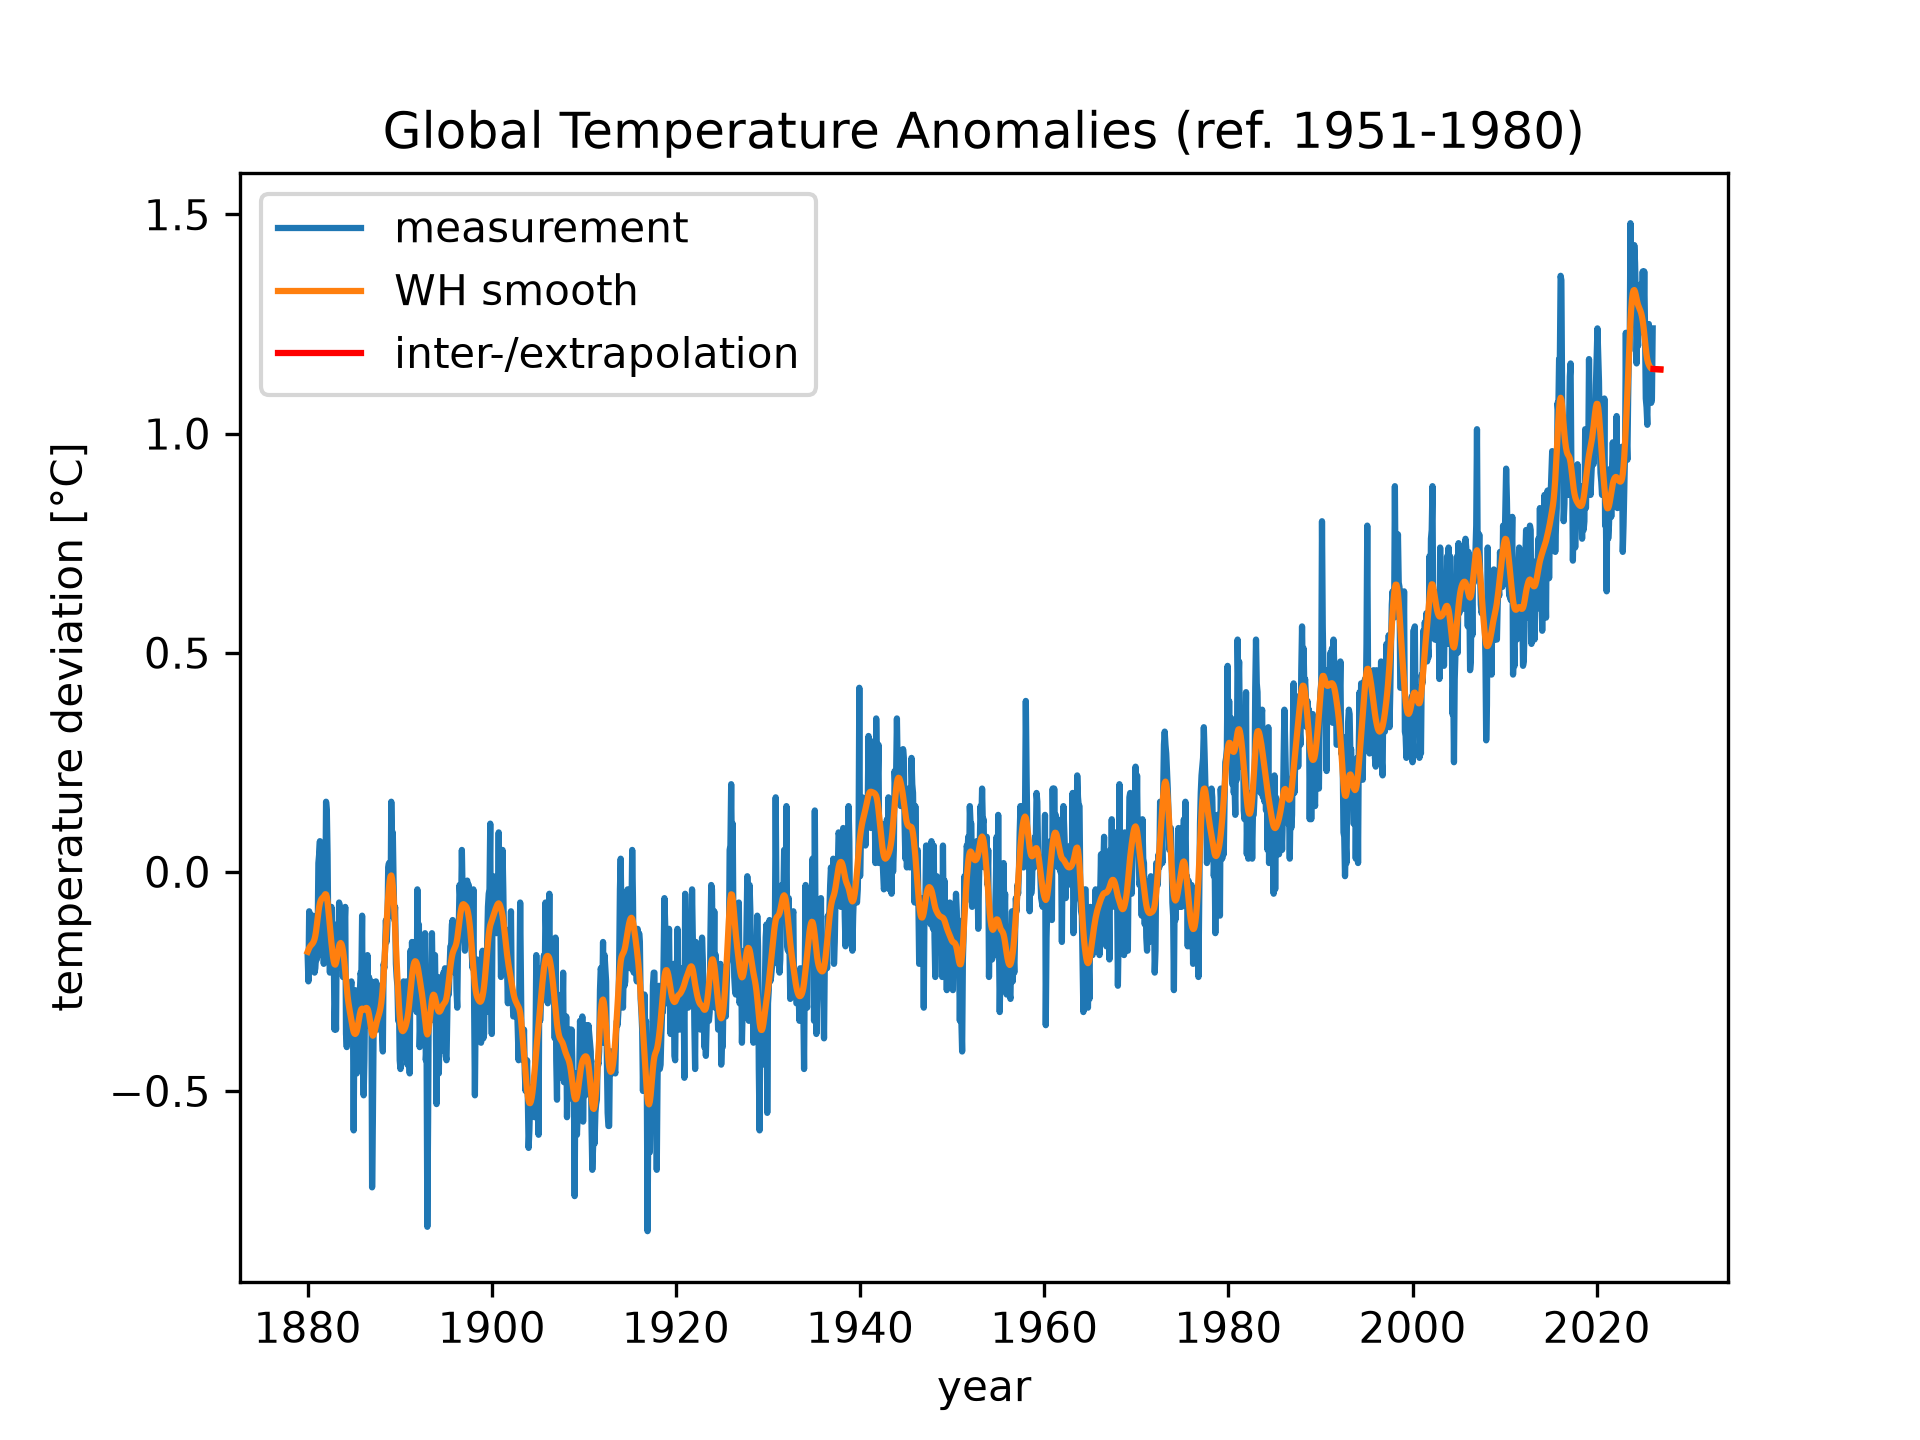
We use data from https://data.giss.nasa.gov/gistemp/ for global temperature anomalies, i.e., deviations from the corresponding 1951-1980 means (Combined Land-Surface Air and Sea-Surface Water Temperature Anomalies, Land-Ocean Temperature Index, L-OTI). We use weights to indicate where to inter- and extrapolate the missing data.from pathlib import Path import numpy as np import scipy from scipy.signal import whittaker_henderson # For the most recent data, use # fname="https://data.giss.nasa.gov/gistemp/tabledata_v4/GLB.Ts+dSST.csv" # Here, we instead use a copy made in 2026. fname = Path(scipy.signal.__file__).parent / "tests/data/GLB.Ts+dSST.csv" data = np.genfromtxt( fname=fname, delimiter=",", skip_header=2, missing_values="***" ) year = data[:, 0] temperature = data[:, 1:13].ravel() # monthly temperature anomalies w = np.ones_like(temperature) # We might have some nan values. np.sum(np.isnan(temperature)) w[np.isnan(temperature)] = 0 res = whittaker_henderson(temperature, weights=w)✓
temperature[:5]
res.x[:5]
✗
array([-0.18, -0.18, -0.17, -0.17, -0.17])Let us plot measurements and Whittaker-Henderson smoothing.
import matplotlib.pyplot as plt
x = year[0] + np.arange(len(temperature)) / 12
✓
plt.plot(x, temperature, label="measurement")
plt.plot(x, res.x, label="WH smooth")
# Above, we set w = 0 for nan values of temperature. WH automatically
# inter- or extrapolates for all data points with w = 0.
plt.plot(x[w==0], res.x[w==0], color="red", label="inter-/extrapolation")
plt.xlabel("year")
plt.ylabel("temperature deviation [°C]")
plt.title("Global Temperature Anomalies (ref. 1951-1980)")
plt.legend()
✗
<matplotlib.legend.Legend object at 0x7fa8fe66cad0>
plt.show()
✓
Aliases
scipy.signal.whittaker_henderson