bundles / scipy 1.18.0 / scipy / signal / windows / _windows / dpss
function
scipy.signal.windows._windows:dpss
Signature
def dpss(M, NW, Kmax = None, sym = True, norm = None, return_ratios = False, *, xp = None, device = None)Summary
Compute the Discrete Prolate Spheroidal Sequences (DPSS).
Extended Summary
DPSS (or Slepian sequences) are often used in multitaper power spectral density estimation (see [1]). The first window in the sequence can be used to maximize the energy concentration in the main lobe, and is also called the Slepian window.
Parameters
M: intWindow length.
NW: floatStandardized half bandwidth corresponding to
2*NW = BW/f0 = BW*M*dtwheredtis taken as 1.Kmax: int | None, optionalNumber of DPSS windows to return (orders
0throughKmax-1). If None (default), return only a single window of shape(M,)instead of an array of windows of shape(Kmax, M).sym: bool, optionalWhen True (default), generates a symmetric window, for use in filter design. When False, generates a periodic window, for use in spectral analysis.
norm: {2, 'approximate', 'subsample'} | None, optionalIf 'approximate' or 'subsample', then the windows are normalized by the maximum, and a correction scale-factor for even-length windows is applied either using
M**2/(M**2+NW)("approximate") or a FFT-based subsample shift ("subsample"), see Notes for details. If None, then "approximate" is used whenKmax=Noneand 2 otherwise (which uses the l2 norm).return_ratios: bool, optionalIf True, also return the concentration ratios in addition to the windows.
xp: array_namespace, optionalOptional array namespace. Should be compatible with the array API standard, or supported by array-api-compat. Default:
numpydevice: anyoptional device specification for output. Should match one of the supported device specification in
xp.
Returns
v: ndarray, shape (Kmax, M) or (M,)The DPSS windows. Will be 1D if
Kmaxis None.r: ndarray, shape (Kmax,) or float, optionalThe concentration ratios for the windows. Only returned if
return_ratiosevaluates to True. Will be 0D ifKmaxis None.
Notes
This computation uses the tridiagonal eigenvector formulation given in [2].
The default normalization for Kmax=None, i.e. window-generation mode, simply using the l-infinity norm would create a window with two unity values, which creates slight normalization differences between even and odd orders. The approximate correction of M**2/float(M**2+NW) for even sample numbers is used to counteract this effect (see Examples below).
For very long signals (e.g., 1e6 elements), it can be useful to compute windows orders of magnitude shorter and use interpolation (e.g., scipy.interpolate.interp1d) to obtain tapers of length M, but this in general will not preserve orthogonality between the tapers.
Examples
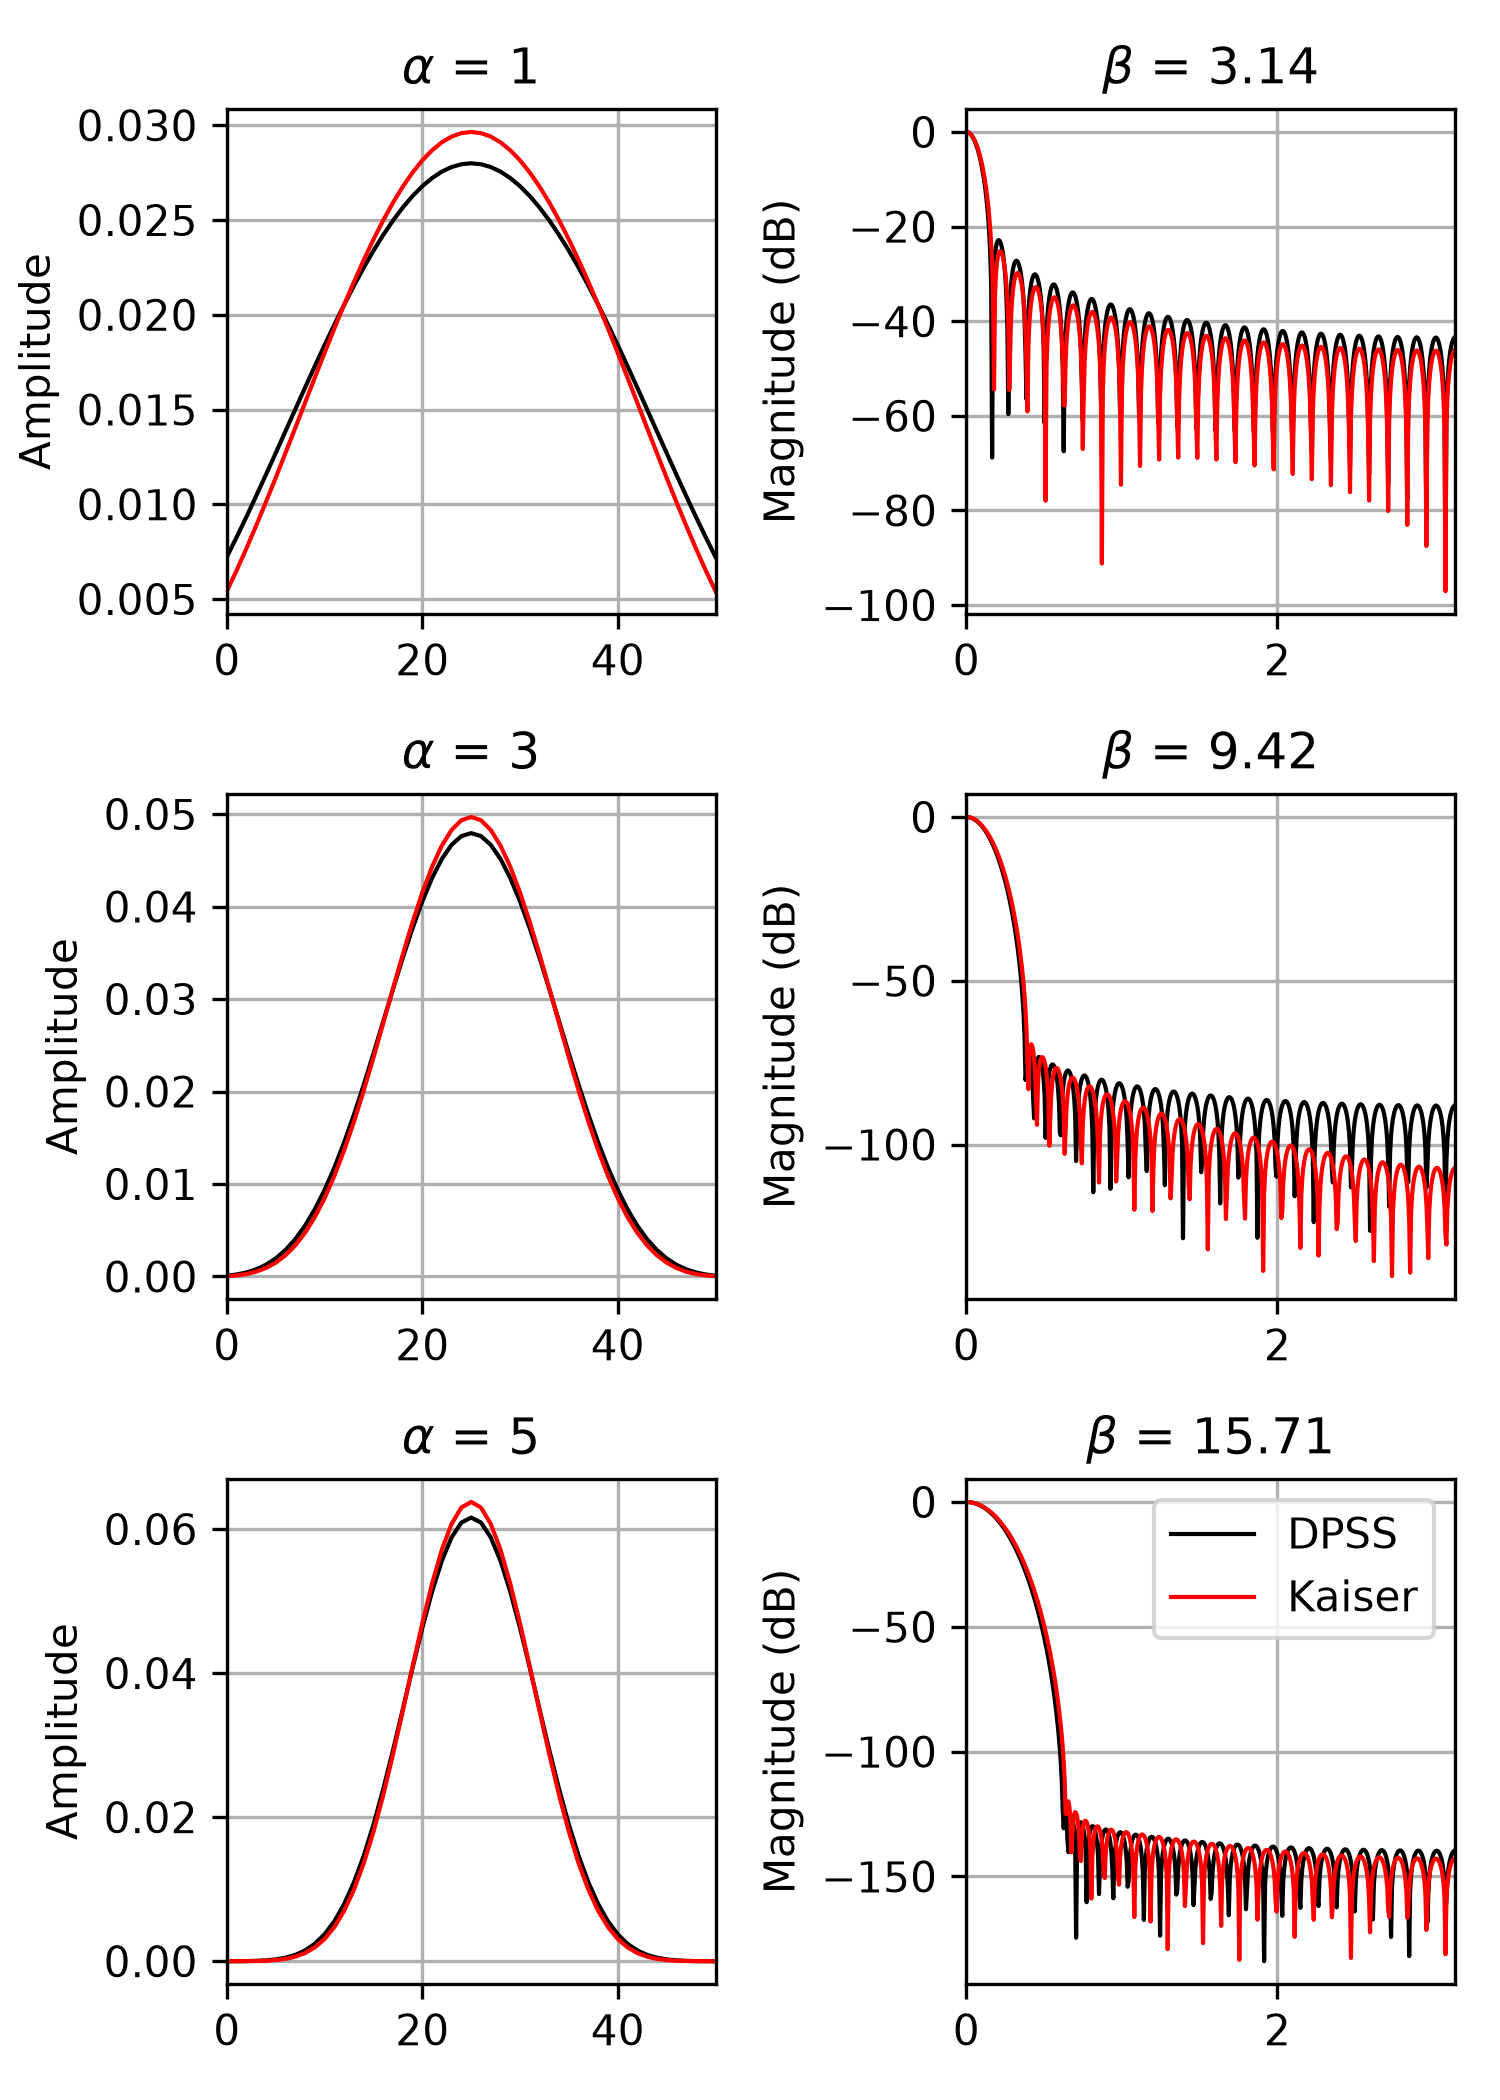
We can compare the window to `kaiser`, which was invented as an alternative that was easier to calculate [3]_ (example adapted from `here <https://ccrma.stanford.edu/~jos/sasp/Kaiser_DPSS_Windows_Compared.html>`_):import numpy as np import matplotlib.pyplot as plt from scipy.signal import windows, freqz M = 51 fig, axes = plt.subplots(3, 2, figsize=(5, 7))✓
for ai, alpha in enumerate((1, 3, 5)):
    win_dpss = windows.dpss(M, alpha)
    beta = alpha*np.pi
    win_kaiser = windows.kaiser(M, beta)
    for win, c in ((win_dpss, 'k'), (win_kaiser, 'r')):
        win /= win.sum()
        axes[ai, 0].plot(win, color=c, lw=1.)
        axes[ai, 0].set(xlim=[0, M-1], title=rf'$\alpha$ = {alpha}',
                        ylabel='Amplitude')
        w, h = freqz(win)
        axes[ai, 1].plot(w, 20 * np.log10(np.abs(h)), color=c, lw=1.)
        axes[ai, 1].set(xlim=[0, np.pi],
                        title=rf'$\beta$ = {beta:0.2f}',
                        ylabel='Magnitude (dB)')
✗
[<matplotlib.lines.Line2D object at 0x7fa8f6491be0>]
[(0.0, 50.0), Text(0.5, 1.0, '$\\alpha$ = 1'), Text(0, 0.5, 'Amplitude')]
[<matplotlib.lines.Line2D object at 0x7fa8f6492660>]
[(0.0, 3.141592653589793), Text(0.5, 1.0, '$\\beta$ = 3.14'), Text(0, 0.5, 'Magnitude (dB)')]
[<matplotlib.lines.Line2D object at 0x7fa8f6491940>]
[(0.0, 50.0), Text(0.5, 1.0, '$\\alpha$ = 1'), Text(0, 0.5, 'Amplitude')]
[<matplotlib.lines.Line2D object at 0x7fa8f6491d30>]
[(0.0, 3.141592653589793), Text(0.5, 1.0, '$\\beta$ = 3.14'), Text(0, 0.5, 'Magnitude (dB)')]
[<matplotlib.lines.Line2D object at 0x7fa8f6493770>]
[(0.0, 50.0), Text(0.5, 1.0, '$\\alpha$ = 3'), Text(0, 0.5, 'Amplitude')]
[<matplotlib.lines.Line2D object at 0x7fa8f6491e80>]
[(0.0, 3.141592653589793), Text(0.5, 1.0, '$\\beta$ = 9.42'), Text(0, 0.5, 'Magnitude (dB)')]
[<matplotlib.lines.Line2D object at 0x7fa8f6491fd0>]
[(0.0, 50.0), Text(0.5, 1.0, '$\\alpha$ = 3'), Text(0, 0.5, 'Amplitude')]
[<matplotlib.lines.Line2D object at 0x7fa8f6490ad0>]
[(0.0, 3.141592653589793), Text(0.5, 1.0, '$\\beta$ = 9.42'), Text(0, 0.5, 'Magnitude (dB)')]
[<matplotlib.lines.Line2D object at 0x7fa8f64906e0>]
[(0.0, 50.0), Text(0.5, 1.0, '$\\alpha$ = 5'), Text(0, 0.5, 'Amplitude')]
[<matplotlib.lines.Line2D object at 0x7fa8f6493a10>]
[(0.0, 3.141592653589793), Text(0.5, 1.0, '$\\beta$ = 15.71'), Text(0, 0.5, 'Magnitude (dB)')]
[<matplotlib.lines.Line2D object at 0x7fa8f6490ec0>]
[(0.0, 50.0), Text(0.5, 1.0, '$\\alpha$ = 5'), Text(0, 0.5, 'Amplitude')]
[<matplotlib.lines.Line2D object at 0x7fa8f6491400>]
[(0.0, 3.141592653589793), Text(0.5, 1.0, '$\\beta$ = 15.71'), Text(0, 0.5, 'Magnitude (dB)')]
for ax in axes.ravel():
    ax.grid(True)
✓
axes[2, 1].legend(['DPSS', 'Kaiser'])
✗<matplotlib.legend.Legend object at 0x7fa8f6493e00>
fig.tight_layout()
plt.show()
✓
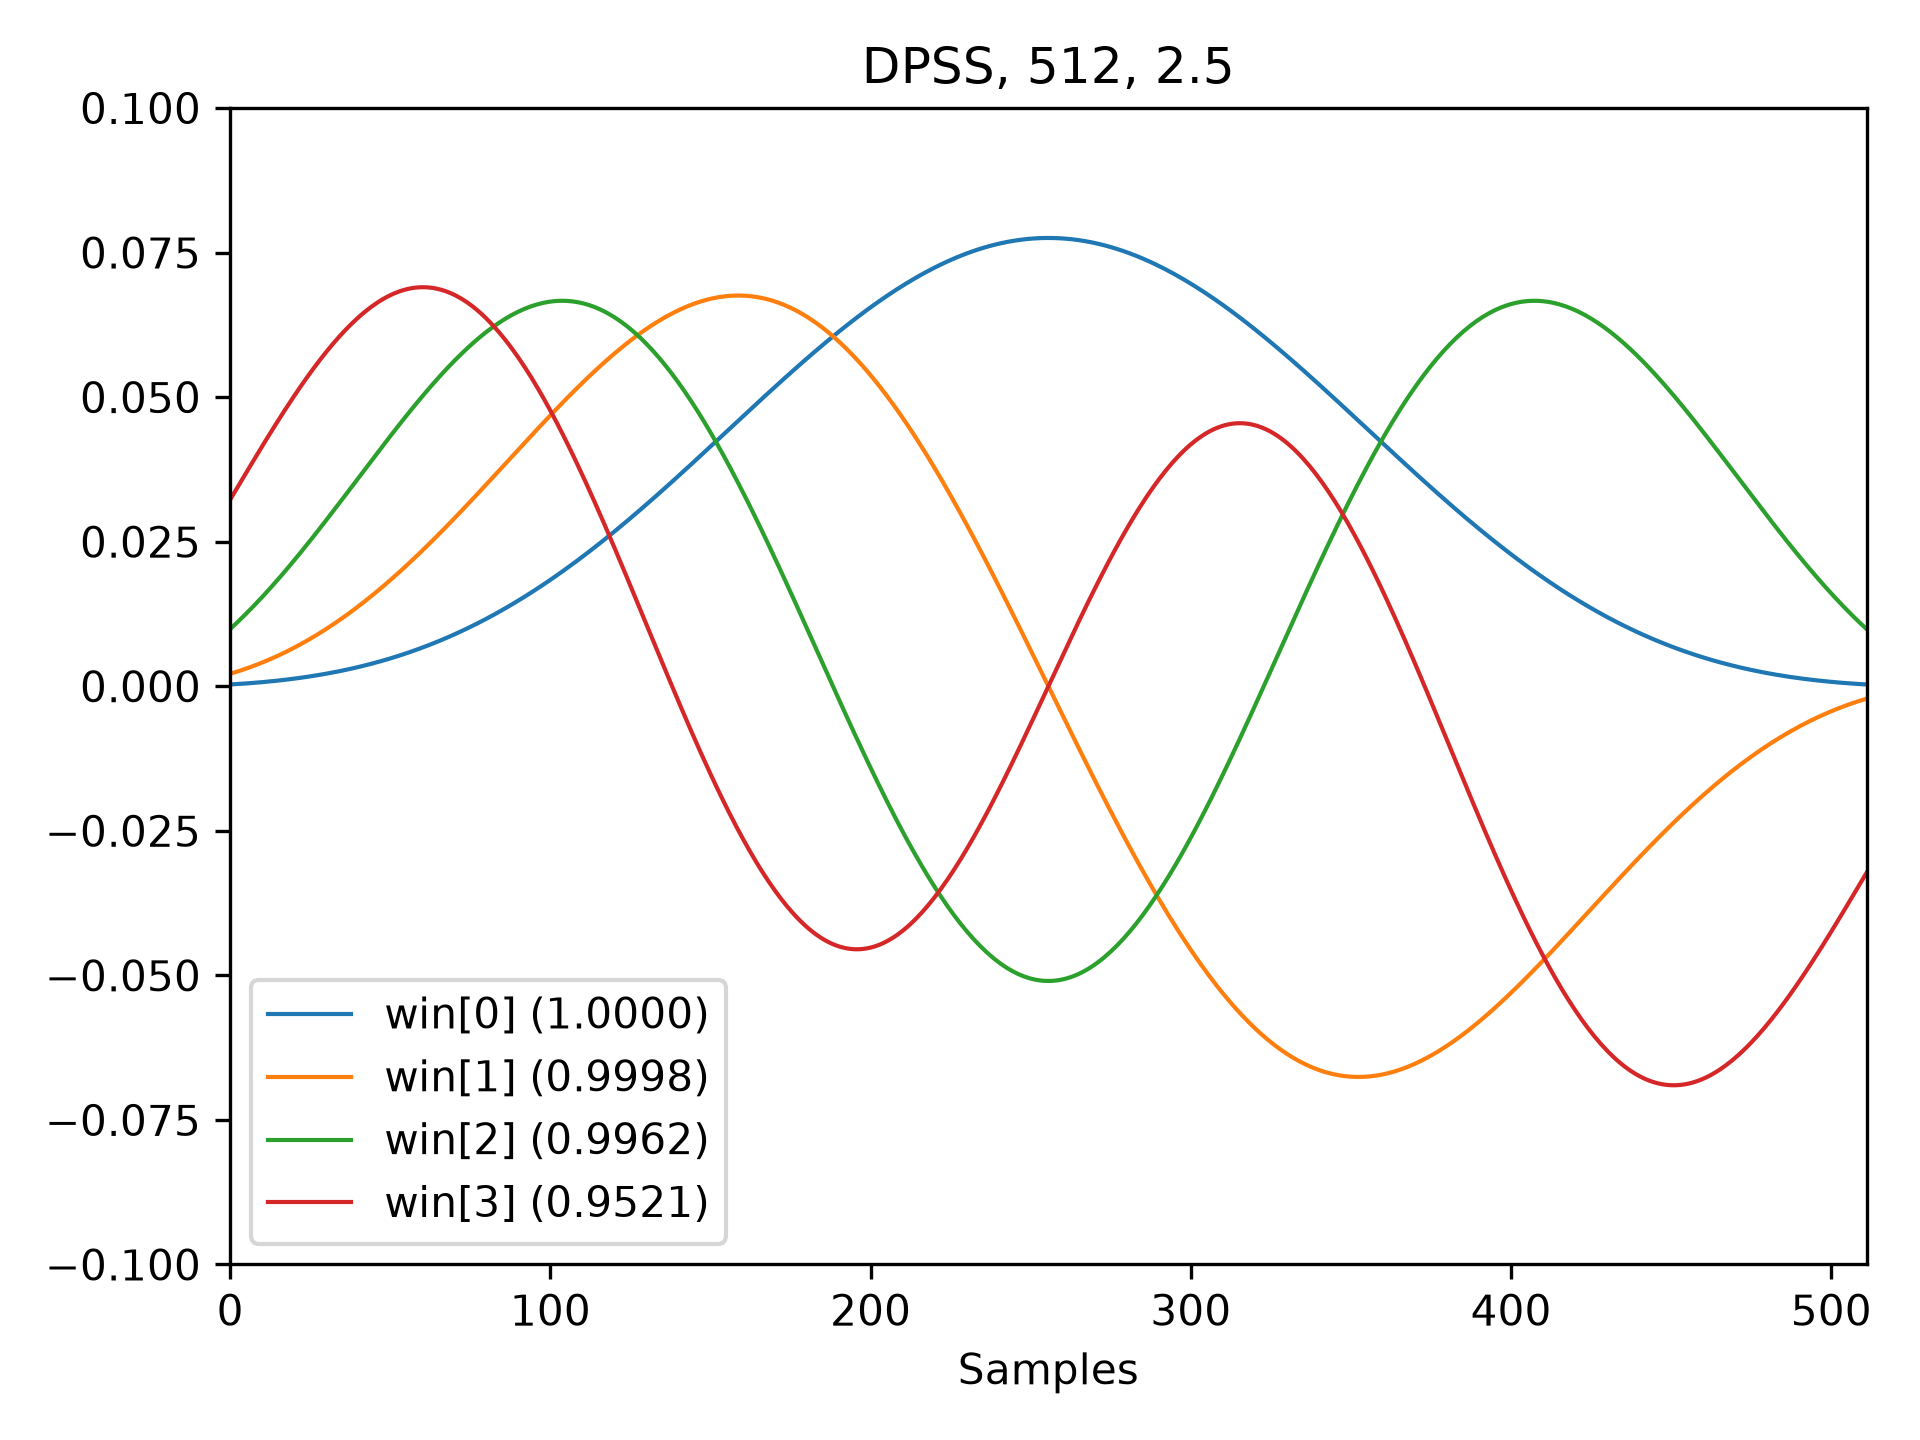
M = 512
NW = 2.5
win, eigvals = windows.dpss(M, NW, 4, return_ratios=True)
fig, ax = plt.subplots(1)
✓
ax.plot(win.T, linewidth=1.)
ax.set(xlim=[0, M-1], ylim=[-0.1, 0.1], xlabel='Samples',
       title=f'DPSS, {M:d}, {NW:0.1f}')
ax.legend([f'win[{ii}] ({ratio:0.4f})'
           for ii, ratio in enumerate(eigvals)])
✗
<matplotlib.legend.Legend object at 0x7fa8f6d3c6e0>
fig.tight_layout()
plt.show()
✓
Ms = np.arange(1, 41)
factors = (50, 20, 10, 5, 2.0001)
energy = np.empty((3, len(Ms), len(factors)))
for mi, M in enumerate(Ms):
    for fi, factor in enumerate(factors):
        NW = M / float(factor)
        # Corrected using empirical approximation (default)
        win = windows.dpss(M, NW)
        energy[0, mi, fi] = np.sum(win ** 2) / np.sqrt(M)
        # Corrected using subsample shifting
        win = windows.dpss(M, NW, norm='subsample')
        energy[1, mi, fi] = np.sum(win ** 2) / np.sqrt(M)
        # Uncorrected (using l-infinity norm)
        win /= win.max()
        energy[2, mi, fi] = np.sum(win ** 2) / np.sqrt(M)
fig, ax = plt.subplots(1)
hs = ax.plot(Ms, energy[2], '-o', markersize=4,
             markeredgecolor='none')
leg = [hs[-1]]
for hi, hh in enumerate(hs):
    h1 = ax.plot(Ms, energy[0, :, hi], '-o', markersize=4,
                 color=hh.get_color(), markeredgecolor='none',
                 alpha=0.66)
    h2 = ax.plot(Ms, energy[1, :, hi], '-o', markersize=4,
                 color=hh.get_color(), markeredgecolor='none',
                 alpha=0.33)
    if hi == len(hs) - 1:
        leg.insert(0, h1[0])
        leg.insert(0, h2[0])
✓
ax.set(xlabel='M (samples)', ylabel=r'Power / $\sqrt{M}$')
ax.legend(leg, ['Uncorrected', r'Corrected: $\frac{M^2}{M^2+NW}$',
                'Corrected (subsample)'])
✗
<matplotlib.legend.Legend object at 0x7fa8feacda90>
fig.tight_layout()
✓Aliases
scipy.signal.windows.dpss