bundles / scipy 1.18.0 / scipy / stats / _quantile / estimated_cdf
function
scipy.stats._quantile:estimated_cdf
source: /scipy/stats/_quantile.py:552
Signature
def estimated_cdf(x, y, *, method = linear, axis = 0, nan_policy = propagate, keepdims = None)Summary
Estimate the CDF of the distribution underlying a sample.
Parameters
x: array_like of real numbersData array.
y: array_like of real numbersPoints at which to evaluate the estimated cdf. See
axis,keepdims, and the examples for broadcasting behavior.method: str, default: 'linear'The method to use for estimating the cumulative distribution function. The available options, numbered as they appear in [1], are:
'inverted_cdf' (AKA the empirical cumulative distribution function)
'averaged_inverted_cdf'
'closest_observation'
'interpolated_inverted_cdf'
'hazen'
'weibull'
'linear' (default)
'median_unbiased'
'normal_unbiased'
See Notes for details.
axis: int or None, default: 0Axis along which samples in
xare given in ND case.Noneravels bothxandybefore performing the calculation, without checking whether the original shapes were compatible. As in other scipy.stats functions, a positive integeraxisis resolved after prepending 1s to the shape ofxoryas needed until the two arrays have the same dimensionality. When providingxandywith different dimensionality, consider using negativeaxisintegers for clarity.nan_policy: str, default: 'propagate'Defines how to handle NaNs in the input data
x.propagate: if a NaN is present in the axis slice (e.g. row) along which the statistic is computed, the corresponding slice of the output will contain NaN(s).omit: NaNs will be omitted when performing the calculation. If insufficient data remains in the axis slice along which the statistic is computed, the corresponding slice of the output will contain NaN(s).raise: if a NaN is present, aValueErrorwill be raised.
If NaNs are present in
y, the corresponding entries in the output will be NaN.keepdims: bool, optionalConsider the case in which
xis 1-D andyis a scalar: the estimated cumulative distribution function at a point is a reducing statistic, and the default behavior is to return a scalar. Ifkeepdimsis set to True, the axis will not be reduced away, and the result will be a 1-D array with one element.The general case is more subtle, since multiple values of
ymay be specified for each axis-slice ofx. For instance, if bothxandyare 1-D andy.size > 1, no axis can be reduced away; there must be an axis to contain the number of values given byy.size. Therefore:By default, the axis will be reduced away if possible (i.e. if there is exactly one element of
yper axis-slice ofx).If
keepdimsis set to True, the axis will not be reduced away.If
keepdimsis set to False, the axis will be reduced away if possible, and an error will be raised otherwise.
Returns
probability: scalar or ndarrayThe resulting probabilities(s). The dtype is the result dtype of
x,y, and the Pythonfloattype.
Notes
Given a sample x from an underlying distribution, estimated_cdf provides a nonparametric estimate of the cumulative distribution function.
By default, this is done by computing the "fractional index" p at which y would appear within z, a sorted copy of x:
p = 1 / (n - 1) * (j +  (     y - z[j])
                      / (z[j+1] - z[j]))
where the index j is that of the largest element of z that does not exceed y, and n is the number of elements in the sample. Note that if y is an element of z, then j is the index such that y = z[j], and the formula simplifies to the intuitive j / (n - 1). The full formula linearly interpolates between j / (n - 1) and (j + 1) / (n - 1).
This is a special case of the more general
p = (j + (y - z[j]) / (z[j+1] - z[j] + 1 - m) / nwhere m may be defined according to several different conventions. The preferred convention may be selected using the method parameter:
=============================== =============== ===============
``method``                      number in H&F   ``m``
=============================== =============== ===============
``interpolated_inverted_cdf``   4               ``0``
``hazen``                       5               ``1/2``
``weibull``                     6               ``p``
``linear`` (default)            7               ``1 - p``
``median_unbiased``             8               ``p/3 + 1/3``
``normal_unbiased``             9               ``p/4 + 3/8``
=============================== =============== ===============
Note that indices j and j + 1 are clipped to the range 0 to n - 1 when the results of the formula would be outside the allowed range of non-negative indices, and resulting p is clipped to the range 0 to 1.
The table above includes only the estimators from [1] that are continuous functions of probability p (estimators 4-9). SciPy also provides the three discontinuous estimators from [1] (estimators 1-3), where j is defined as above, m is defined as follows, and g is 0 when index = p*n + m - 1 is less than 0 and otherwise is defined below.
inverted_cdf:m = 0andg = int(index - j > 0)averaged_inverted_cdf:m = 0andg = (1 + int(index - j > 0)) / 2closest_observation:m = -1/2andg = 1 - int((index == j) & (j%2 == 1))
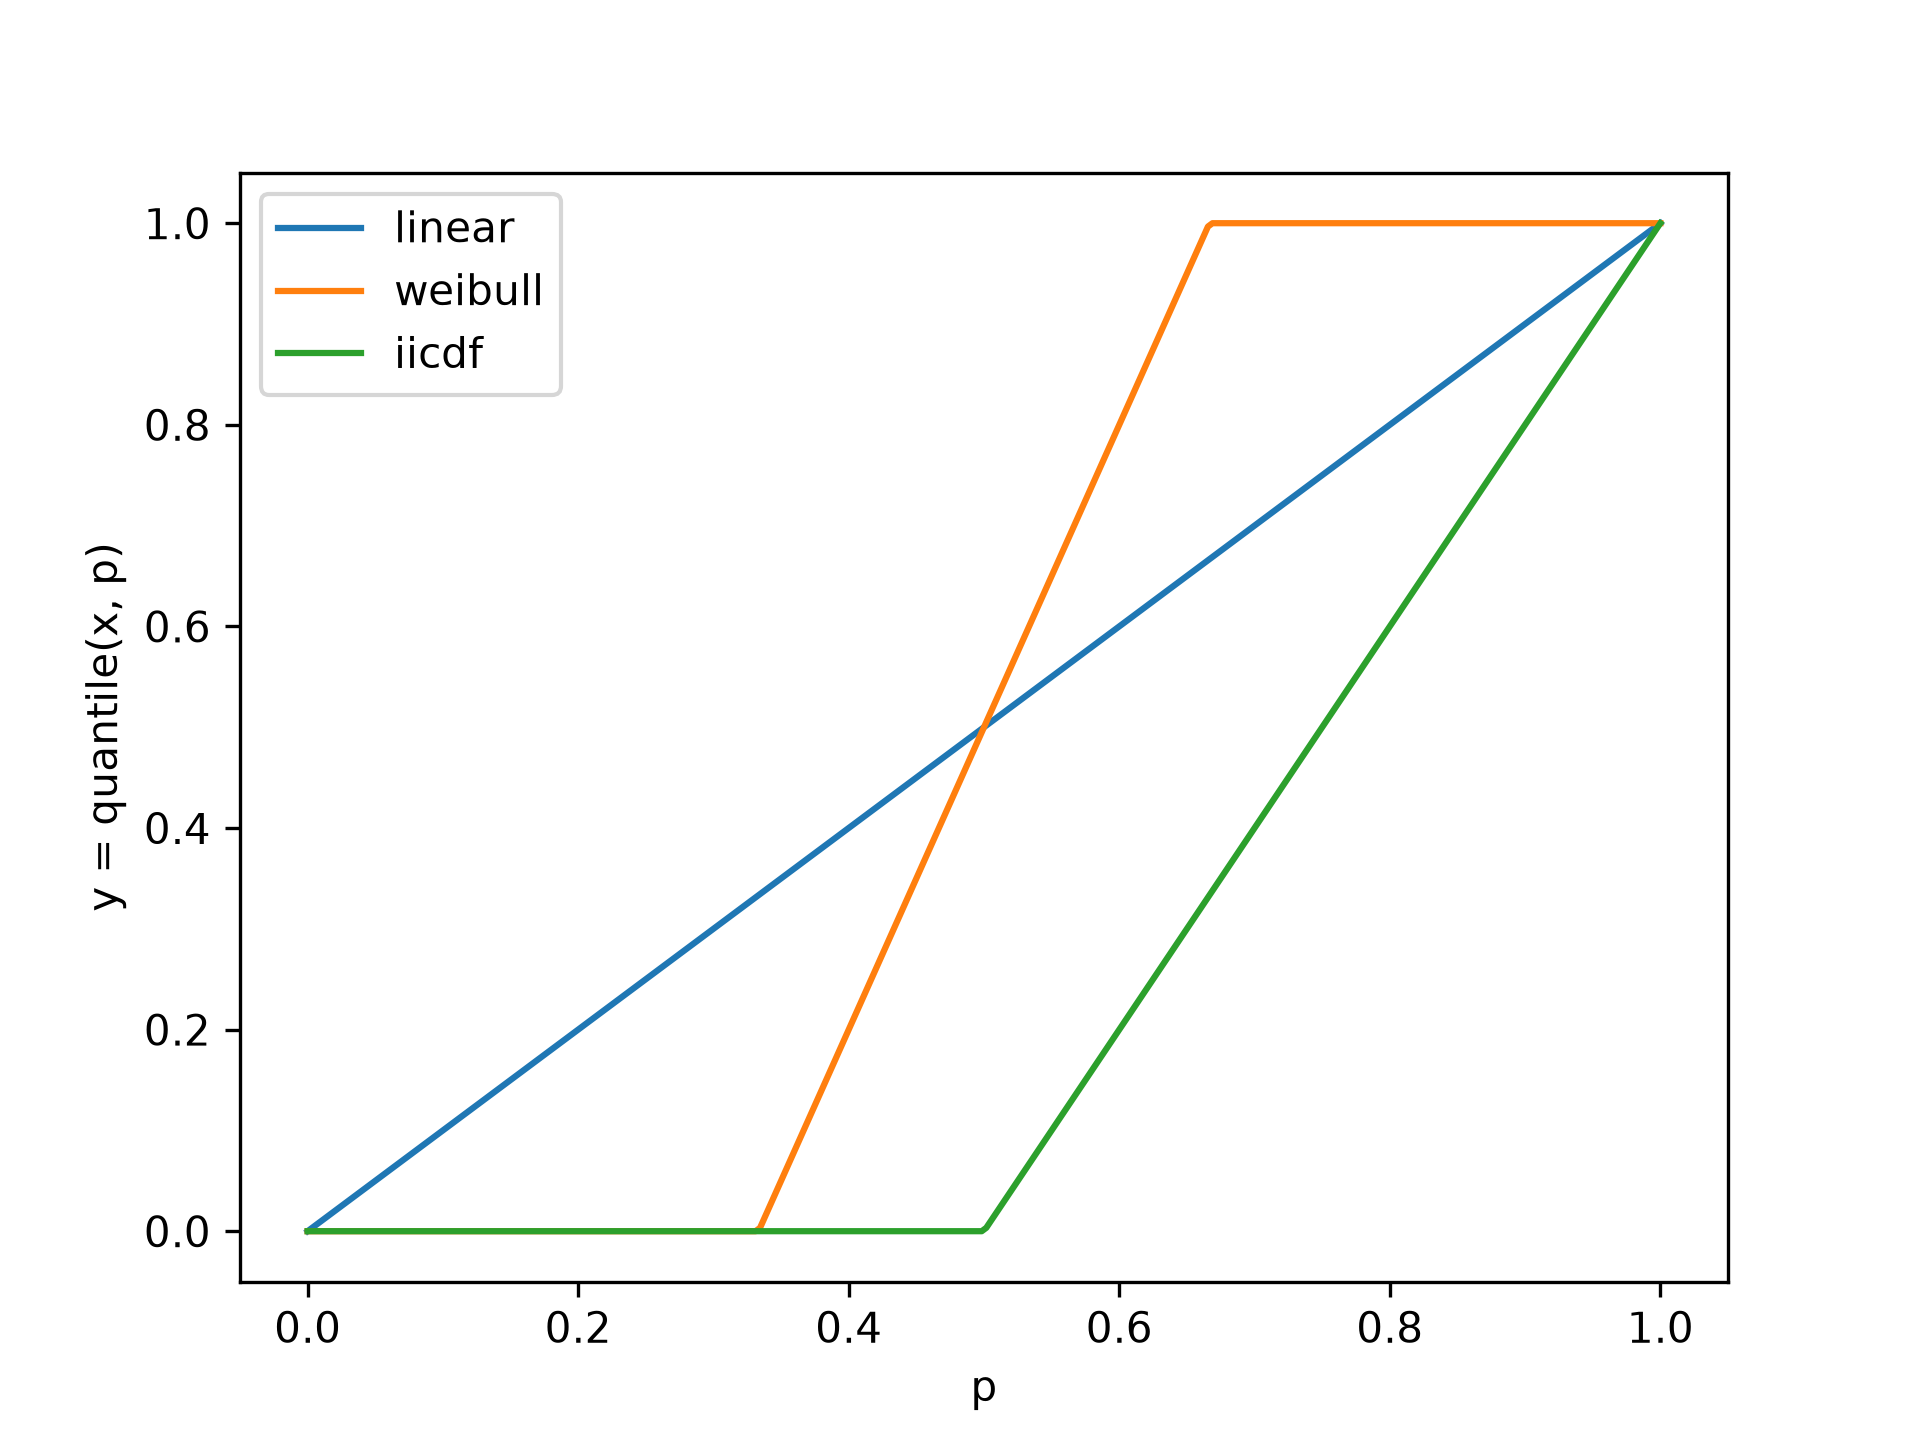
When all the data in x are unique, estimated_cdf and quantile are are inverses of one another within a certain domain. Although quantile with method='linear' is invertible over the whole domain of p from 0 to 1, this is not true of other methods.
Array API Standard Support
estimated_cdf has experimental support for Python Array API Standard compatible backends in addition to NumPy. Please consider testing these features by setting an environment variable SCIPY_ARRAY_API=1 and providing CuPy, PyTorch, JAX, or Dask arrays as array arguments. The following combinations of backend and device (or other capability) are supported.
====================  ====================  ====================
Library               CPU                   GPU
====================  ====================  ====================
NumPy                 ✅                     n/a
CuPy                  n/a                   ✅
PyTorch               ✅                     ✅
JAX                   ✅                     ✅
Dask                  ⛔                     n/a
====================  ====================  ====================
estimated_cdf also accepts MArrays backed by the backends indicated above; masked values will be treated as though they were not present.
See dev-arrayapi for more information.
Examples
import numpy as np
from scipy import stats
x = [0, 1, 2, 3, 4, 5, 6, 7, 8, 9, 10]
✓
stats.estimated_cdf(x, 5, axis=-1)
✓np.float64(0.5)Estimate the cumulative distribution function of one sample at two points.
stats.estimated_cdf(x, [2.5, 7.5], axis=-1)
✓array([0.25, 0.75])Estimate the cumulative distribution function of two samples at different points.
x = np.stack((np.arange(0, 11), np.arange(10, 21)))
stats.estimated_cdf(x, [[2.5], [17.5]], axis=-1, keepdims=True)
✓
array([[0.25],
       [0.75]])
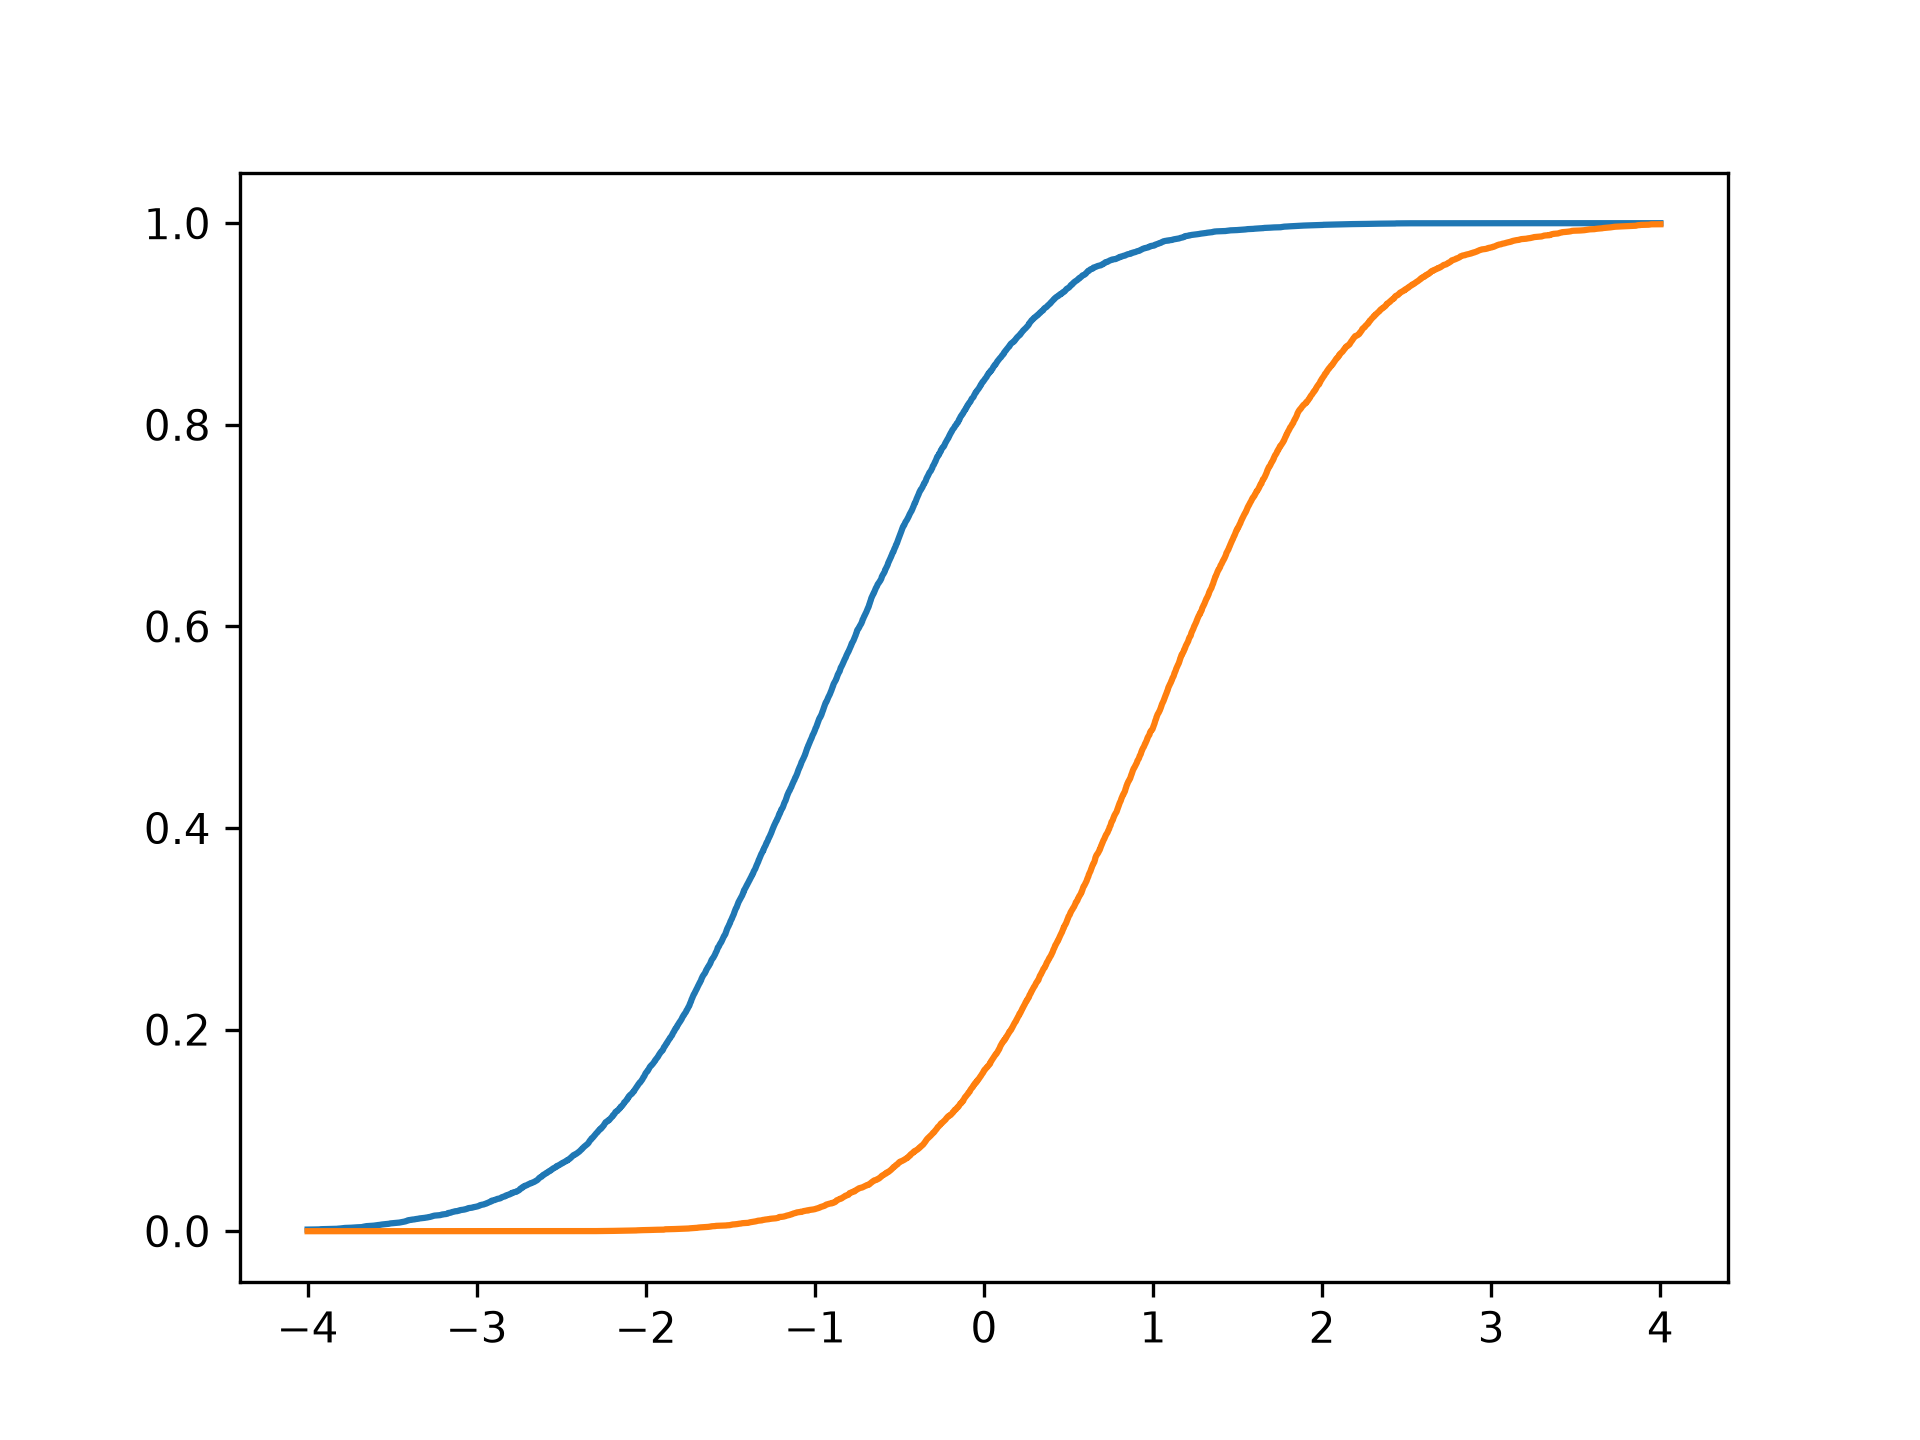
Estimate the cumulative distribution function at many points for each of two
samples.
import matplotlib.pyplot as plt
rng = np.random.default_rng(6110515095)
x = stats.Normal(mu=[-1, 1]).sample(10000)
y = np.linspace(-4, 4, 5000)[:, np.newaxis]
p = stats.estimated_cdf(x, y, axis=0)
✓
plt.plot(y, p)
✗[<matplotlib.lines.Line2D object at 0x7fa8e4a72270>, <matplotlib.lines.Line2D object at 0x7fa8e4a72120>]
plt.show()
✓
p = np.linspace(0, 1, 300)
x = rng.standard_normal(300)
y = stats.quantile(x, p)
p2 = stats.estimated_cdf(x, y)
np.testing.assert_allclose(p2, p)
y2 = stats.quantile(x, p2)
np.testing.assert_allclose(y2, y)
✓
x = np.asarray([0, 1])
y_linear = stats.quantile(x, p, method='linear')
y_weibull = stats.quantile(x, p, method='weibull')
y_iicdf = stats.quantile(x, p, method='interpolated_inverted_cdf')
✓
plt.plot(p, y_linear, p, y_weibull, p, y_iicdf)
plt.legend(['linear', 'weibull', 'iicdf'])
plt.xlabel('p')
plt.ylabel('y = quantile(x, p)')
✗
Text(0, 0.5, 'y = quantile(x, p)')
plt.show()
✓
See also
Aliases
scipy.stats.estimated_cdf