bundles / scipy 1.18.0 / scipy / stats / _survival / logrank
function
scipy.stats._survival:logrank
source: /scipy/stats/_survival.py:488
Signature
def logrank(x: npt.ArrayLike | CensoredData, y: npt.ArrayLike | CensoredData, alternative: Literal['two-sided', 'less', 'greater'] = two-sided) → LogRankResultSummary
Compare the survival distributions of two samples via the logrank test.
Parameters
x, y: array_like or CensoredDataSamples to compare based on their empirical survival functions.
alternative: {'two-sided', 'less', 'greater'}, optionalDefines the alternative hypothesis.
The null hypothesis is that the survival distributions of the two groups, say X and Y, are identical.
The following alternative hypotheses [4] are available (default is 'two-sided'):
'two-sided': the survival distributions of the two groups are not identical.
'less': survival of group X is favored: the group X failure rate function is less than the group Y failure rate function at some times.
'greater': survival of group Y is favored: the group X failure rate function is greater than the group Y failure rate function at some times.
Returns
res: `~scipy.stats._result_classes.LogRankResult`An object containing attributes:
statistic
The computed statistic (defined below). Its magnitude is the square root of the magnitude returned by most other logrank test implementations.
pvalue
The computed p-value of the test.
Notes
The logrank test [1] compares the observed number of events to the expected number of events under the null hypothesis that the two samples were drawn from the same distribution. The statistic is
where
denotes the group (i.e. it may assume values or , or it may be omitted to refer to the combined sample) denotes the time (at which an event occurred), is the number of subjects at risk just before an event occurred, and is the observed number of events at that time.
The statistic returned by logrank is the (signed) square root of the statistic returned by many other implementations. Under the null hypothesis, is asymptotically distributed according to the chi-squared distribution with one degree of freedom. Consequently, is asymptotically distributed according to the standard normal distribution. The advantage of using is that the sign information (i.e. whether the observed number of events tends to be less than or greater than the number expected under the null hypothesis) is preserved, allowing scipy.stats.logrank to offer one-sided alternative hypotheses.
Examples
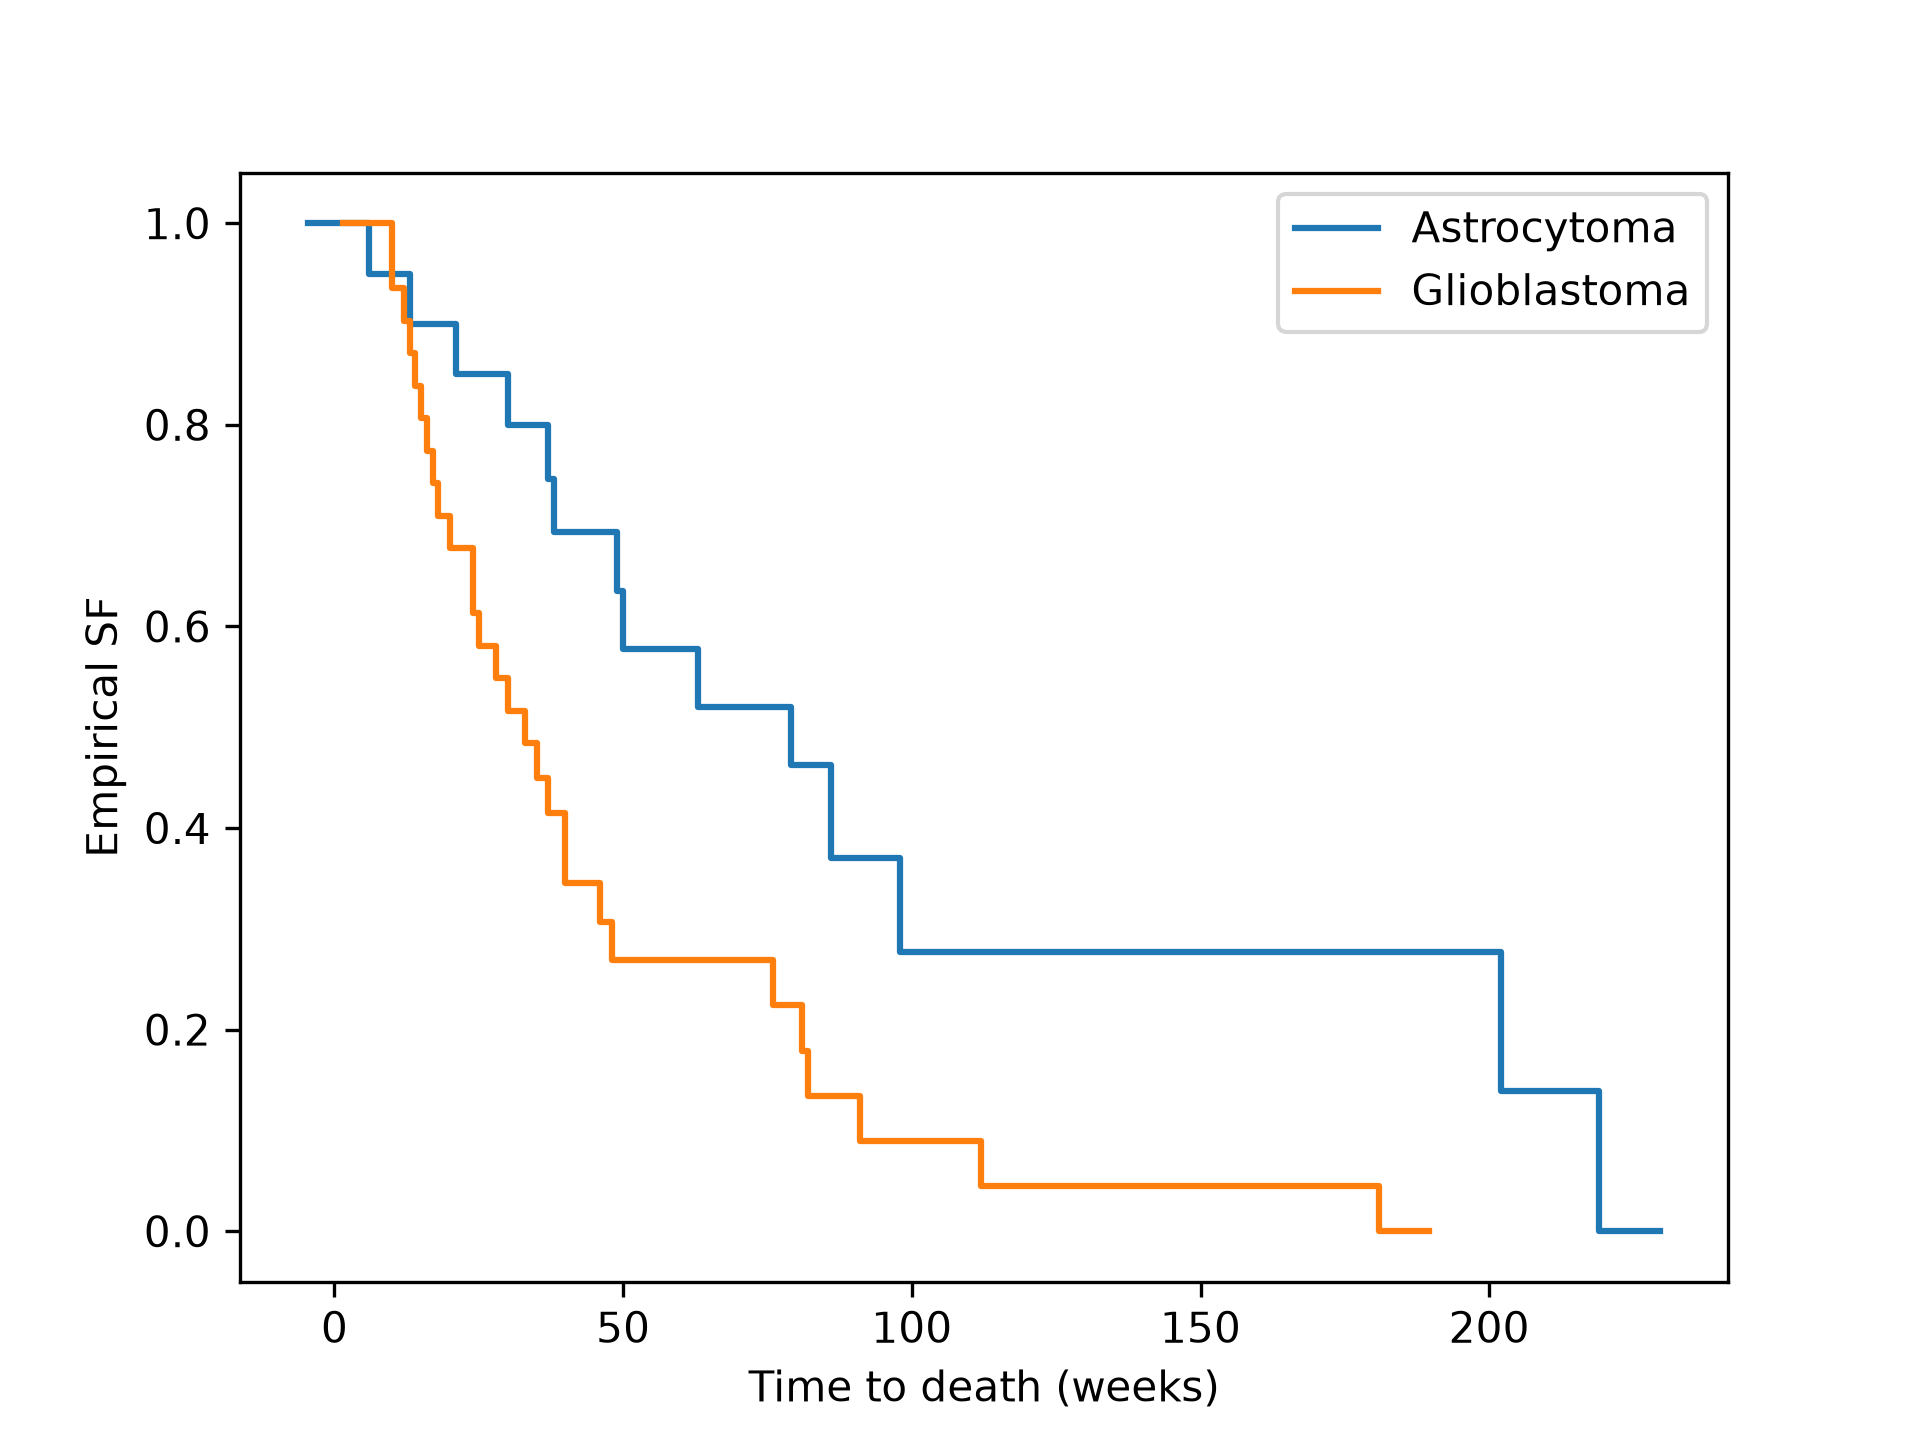
Reference [2]_ compared the survival times of patients with two different types of recurrent malignant gliomas. The samples below record the time (number of weeks) for which each patient participated in the study. The `scipy.stats.CensoredData` class is used because the data is right-censored: the uncensored observations correspond with observed deaths whereas the censored observations correspond with the patient leaving the study for another reason.from scipy import stats x = stats.CensoredData( uncensored=[6, 13, 21, 30, 37, 38, 49, 50, 63, 79, 86, 98, 202, 219], right=[31, 47, 80, 82, 82, 149] ) y = stats.CensoredData( uncensored=[10, 10, 12, 13, 14, 15, 16, 17, 18, 20, 24, 24, 25, 28,30, 33, 35, 37, 40, 40, 46, 48, 76, 81, 82, 91, 112, 181], right=[34, 40, 70] )✓
import numpy as np
import matplotlib.pyplot as plt
ax = plt.subplot()
ecdf_x = stats.ecdf(x)
✓
ecdf_x.sf.plot(ax, label='Astrocytoma')
✗[<matplotlib.lines.Line2D object at 0x7fa8e47eecf0>]
ecdf_y = stats.ecdf(y)
✓ecdf_y.sf.plot(ax, label='Glioblastoma') ax.set_xlabel('Time to death (weeks)') ax.set_ylabel('Empirical SF') plt.legend()✗
<matplotlib.legend.Legend object at 0x7fa8e47eea50>
plt.show()
✓
res = stats.logrank(x=x, y=y)
✓res.statistic res.pvalue✗
np.float64(0.006181578637461755)The p-value is less than 1%, so we can consider the data to be evidence against the null hypothesis in favor of the alternative that there is a difference between the two survival functions.
See also
Aliases
scipy.stats.logrank