bundles / scipy 2.0.0.dev0+git20260907.41eeb59 /docs
Doc
Discrete Fourier Transforms (scipy.fft)
docs/tutorial:fft
Fourier analysis is a method for expressing a function as a sum of periodic components, and for recovering the signal from those components. When both the function and its Fourier transform are replaced with discretized counterparts, it is called the discrete Fourier transform (DFT). The DFT has become a mainstay of numerical computing in part because of a very fast algorithm for computing it, called the Fast Fourier Transform (FFT), which was known to Gauss (1805) and was brought to light in its current form by Cooley and Tukey [1]. Press et al. [2] provide an accessible introduction to Fourier analysis and its applications.
This chapter is structured as follows: The first section defines the discrete Fourier transform and presents its key properties. The second section discusses the relationship to continuous Fourier series and introduces various forms of its Fourier transform. Then practical implications, which mainly results from the DFT's periodicity properties, are discussed in the tutorial_FFT_Caveats section. The remaining sections give definitions of higher-dimensional DFTs, discrete sine and cosine transforms as well as the Hankel transform.
The Discrete Fourier Transform
The discrete Fourier Transform [3] is a one-to-one mapping between two complex-valued sequences of length . The mappings between x[k], X[l]\in\IC, with , are defined by
X[l] = \frac{1}{\gamma} \sum_{k=0}^{N-1} x[n] \e^{-\jj 2 \pi l k / N}\,,\qquad
x[k] = \frac{\gamma}{N}\sum_{l=0}^{N-1} X[l] \e^{\jj 2 \pi k l / N}\,,
which are implemented by the fft / ifft functions. is a normalization constant, which is set by the norm parameter. It may have the values (norm='backward', default), (norm='forward'), or (norm='ortho').
Note that can be continued periodically outside its domain . I.e., for p\in\IZ when is calculated with Eq. eq_FFT_DFT. This allows to define the DFT over shifted coefficients, e.g., using . The same holds for : When determined with Eq. eq_FFT_DFT, , p \in\IZ is true.
This DFT can be rewritten in vector-matrix form as
\underbrace{\begin{bmatrix} X[0]\\ X[1]\\ \vdots\\ X[N-1] \end{bmatrix}}_{=:\vb{X}}
  = \frac{1}{\gamma}\underbrace{\begin{bmatrix}
     \e^{-\jj 2 \pi \cdot 0 \cdot 0 / N} & \cdots & \e^{-\jj 2 \pi \cdot 0 \cdot (N-1) / N}\\
     \vdots & \ddots & \vdots\\
     \e^{-\jj 2 \pi (N-1) \cdot 0 / N} & \cdots & \e^{-\jj 2 \pi (N-1) (N-1) / N}
   \end{bmatrix}}_{=:\mF}
\underbrace{\begin{bmatrix} x[0]\\ x[1]\\ \vdots\\ x[N-1] \end{bmatrix}}_{=:\vb{x}}\,,
with the matrix \mF\in\IC^{N\times N} being symmetric, i.e., \mF^T=\mF. It has the elements F[l, k] = \exp(-\jj2\pi l k / N) and allows the DFT and its inverse to be expressed as
\vb{X} = \frac{1}{\gamma}\mF\,\vb{x}\,, \qquad
\vb{x} = \frac{\gamma}{N}\conj{\mF}\,\vb{X}
       = \frac{\gamma}{N}\conjT{\mF}\,\vb{X} \,,
with \conjT{\mF} being the conjugate transpose of \mF. It can be shown that \conjT{\mF}\mF = N\mI holds and thus \mF^{-1} = \conjT{\mF}/N, which makes it straightforward to verify that the two relations of Eq. eq_FFT_DFT are inverses of each other. The linalg module provides the function dft to calculate the matrix \mF / \gamma:
>>> import numpy as np
>>> from scipy.linalg import dft
>>> from scipy.fft import fft
>>> np.set_printoptions(precision=2, suppress=True)  # for compact output
...
>>> dft(4)
array([[ 1.+0.j,  1.+0.j,  1.+0.j,  1.+0.j],
       [ 1.+0.j,  0.-1.j, -1.-0.j, -0.+1.j],
       [ 1.+0.j, -1.-0.j,  1.+0.j, -1.-0.j],
       [ 1.+0.j, -0.+1.j, -1.-0.j,  0.-1.j]])
>>> fft(np.eye(4)) # produces the same matrix
array([[ 1.-0.j,  1.+0.j,  1.-0.j,  1.-0.j],
       [ 1.-0.j,  0.-1.j, -1.-0.j,  0.+1.j],
       [ 1.-0.j, -1.+0.j,  1.-0.j, -1.-0.j],
       [ 1.-0.j,  0.+1.j, -1.-0.j,  0.-1.j]])
This notation makes it also easy to show that the DFT changes the inner product (or scalar product) only by the scaling factor . I.e., expressing the inner product of \vb{X} and \vb{Y} in terms of \vb{x} and \vb{y} gives
\langle \vb{X}, \vb{Y}\rangle := \conjT{\vb{X}}\vb{Y} =
 \conjT{\big(\frac{1}{\gamma}\mF\,\vb{x}\big)}
        \big(\frac{1}{\gamma}\mF\,\vb{y}\big) =
\frac{1}{\gamma^2}\conjT{\vb{x}} \conjT{\mF} \mF \vb{y} =
\frac{N}{\gamma^2}\conjT{\vb{x}} \vb{y} =
\frac{N}{\gamma^2} \langle \vb{x}, \vb{y}\rangle\,.
This illustrates that the DFT is a unitary transform for . The sums of the absolute squares are a special case, i.e.,
\sum_{l=0}^{N-1} \abs{X[l]}^2 =
\langle \vb{X}, \vb{X}\rangle =
\frac{N}{\gamma^2} \langle \vb{x}, \vb{x}\rangle =
\frac{N}{\gamma^2} \sum_{k=0}^{N-1} \abs{x[k]}^2\,.
Note that the sum of the unsquared values can be retrieved from the zeroth DFT component, i.e.,
The circular convolution of two sequences of length , i.e.,
can be expressed as a multiplication of their DFTs and vice versa, i.e.,
Here, the circular convolution is defined over finite length sequences, whereas in literature it is often defined over infinite length sequences. For sufficiently large (roughly: ), it is typically computationally more efficient to use this multiplication together with the fft / ifft functions than to calculate the convolution directly. Note that convolve, fftconvolve and numpy.convolve implement the non-circular convolution by using appropriate zero-padding before applying the FFT.
Fourier Series and the DFT
A Fourier series
z(t) = \frac{\gamma}{N}
         \sum_{l=-N_2}^{N_2} c_l\, \e^{\jj2\pi l t/\tau}\,, \qquad t\in[0, \tau]\,,
with complex-valued Fourier coefficients represents a closed curve z: [0, \tau] \mapsto \IC. Determining the values of equidistant samples with sampling interval , i.e.,
z[k] := z(kT) = \frac{\gamma}{N}
    \sum_{l=-N_2}^{N_2} c_l\, \e^{\jj2\pi l k / N}\,, \qquad
    k \in \{0,\ldots,N-1\}\,,
may be interpreted as a shifted version the inverse DFT of Eq. eq_FFT_DFT. Since the (inverse) DFT is a one-to-one mapping, the samples are an alternative representation of the Fourier coefficients. Here, the scaling factor exists only to ensure notational consistency with Eq. eq_FFT_DFT.
The following example produces a closed curve resembling the letter ω by utilizing a Fourier series: The Fourier coefficients are calculated by the fft function from 31 provided samples. In the plot, the dots represent the samples and the coloration of the line the value of the parameter . Since the fft function expects indexes but is defined on the indexes , the fftshift function is utilized.
Remarks:
That the plot is a closed curve is due to the periodic nature of Fourier series, i.e.,
z(t+p\tau) = z(t)\,,\ p\in\IZ. As a consequence, a given closed curve can be represented by various Fourier series and with that by various sets of samples. E.g., increasing the number of samples can be achieved by adding zero-valued Fourier coefficients to their DFT and then calculating the corresponding inverse DFT. This technique is used in the resample function.A Fourier series is a decomposition of a complex-valued closed curve into circular closed curves with various frequencies: The -th term
z_l(t) := \tfrac{\gamma}{N} c_l\, \exp(\jj2\pi l t / \tau)may be interpreted as a circular curve centered at the origin with radius and starting point . For , it cycles the circle times in counterclockwise direction if or clockwise direction if . The number of cycles per unit interval, i.e, , is usually called the frequency of (having the same sign as ). The fftfreq function determines those corresponding frequencies for the Fourier coefficients.Especially in signal processing, frequently represents time. Hence, the sample values with their associated sample times are commonly referred to as being in the so-called "time-domain", whereas coefficients with their associated frequency values with , are referred as to being in the so-called "frequency domain" or "Fourier domain".
If only real-valued curves are of interest, then
\Im\{z(t)\} = \big(z(t) - \conj{z(t)}\big)/2\jj \equiv 0holds. This is equivalent toz(t) = \conj{z(t)}as well as toc_l = \conj{c_{-l}}. As a consequence, for DFTs with real-valued inputs only the non-negative DFT coefficients need to be calculated. This is implemented by the rfft / irfft / rfftfreq functions.
Besides the DFT, other variations for calculating a Fourier transform of a Fourier series exist. The important case of extending the domain from the fixed interval to the real axis \IR is discussed in the following: When assuming holds for , it is straightforward to apply the continuous Fourier transform to the Fourier Series of Eq. eq_FFT_FSeries:
Z(f) &:= \int_\IR z(t)\, \e^{-\jj2\pi t f} \dd t
  = \frac{\gamma}{N}\sum_{l=-N_2}^{N_2}
           c_l \int_0^\tau \exp\!\big(\jj2\pi (l - f\tau) t / \tau\big)\,  \dd t \\
 &=  \frac{\gamma}{N} \sum_{l=-N_2}^{N_2}
                 c_l\frac{\tau (\e^{\jj2\pi (l - f\tau)} - 1)}{\jj2\pi (l - f\tau)}
  = \tau \frac{\gamma}{N}\sum_{l=-N_2}^{N_2}
                               c_l\, \sinc(l - f\tau)\, \e^{\jj\pi (l - f\tau)} \,,
with \sinc(f) := \sin(\pi f) / (\pi f). Note that is continuous and its support extends over the complete real axis. The DFT may be interpreted as sampling the continuous Fourier transform due to
Z(l \Delta f) = \tau\frac{\gamma}{N} c_l = T \gamma c_l
                                                     \quad\text{ for }\quad l\in\IZ
being true. When continuing periodically outside the interval , i.e.,
z_p(t) = \sum_{p\in\IZ} z(t + p\tau) \,,then the continuous Fourier transform can be expressed as
where denotes the Dirac delta function. Note that is only non-zero at multiples of . Furthermore, is bandlimited, i.e., for . In signal processing, is usually referred to as sampling frequency and is called the Nyquist frequency.
The so-called "discrete-time Fourier transform" (DTFT) [4] of the sampled signal is defined as
Z_p^\text{DTFT}(f) := \sum_{k\in\IZ}  z_p[k] \e^{-2\jj\pi f k T}
\quad\text{ or }\quad
Z_p^\text{DTFT}(\jj\Omega) := \sum_{k\in\IZ}  z_p[k] \e^{-\jj k \Omega}\,,
with . The convention of using the normalized frequency instead of is common in signal processing. is a continuous function in with a periodicity of . Due to being periodic in , it can be expressed in terms of the Fourier coefficients as
Z_p^\text{DTFT}(f) = \frac{\gamma}{N T} \sum_{l=-N_2}^{N_2} \sum_{p\in\IZ}
                                  c_l\, \delta(f - \frac{l}{N T} - \frac{p}{T})
                   = \frac{1}{T} \sum_{p\in\IZ}  Z_p(f - \frac{p}{T}) \,.
Hence, the DTFT may be interpreted as a periodic continuation of , i.e., as the periodic continuation in of the Fourier transform of the continuous-time periodic signal.
A brief introduction about analyzing the spectral properties of sampled signals can be found in the tutorial_SpectralAnalysis section.
Caveats
This subsection briefly discusses practical implications of the periodicity properties of Fourier transforms and provides recommendations for improving computational efficiency.
Periodicity in the Time Domain
When working with sampled signals, it is typically assumed that the underlying continuous signals are represented by Fourier series. The circumstance that to accurately model signals with discontinuities requires many Fourier coefficients is known as Gibbs phenomenon. Since Fourier series are inherently periodic, representing non-periodic signals introduces artificial discontinuities. A common technique to make non-periodic signals "more" periodic is subtracting a best-fit polynomial. detrend can be used to subtract a signal's mean (\ th order polynomial) or linear trend (\ st order polynomial). NumPy's Polynomial class provides means to fit higher order polynomials.
The following example illustrates the effect of removing the linear trend from a noisy signal on its spectrum: The signal is represented by samples with a sampling interval of ms. The first row depicts (with linear trend) and (with removed linear trend). To determine the periodic components, a magnitude spectrum of and of is calculated and drawn is second and third row.
The signal's trend manifests as a decreasing slope in the spectrum's low-frequency part. Removing the linear trend steepens this slope significantly, making the peaks at , , and Hz much better distinguishable. These peaks, which correspond to the sinusoidal components of , would have a magnitude of in a noise- and trend-free signal.
Note that detrending a signal does not necessarily improve its spectrum. I.e., periodic components whose frequencies are not integer multiples of the frequency resolution produce a trend that should not be removed. More information on calculating and interpreting spectra can be found in the tutorial_SpectralAnalysis section.
Periodicity in the Frequency Domain
The following plot compares fft and rfft representations of two signals made up of an odd number (, left column) and an even number of samples (, right column). The real-valued input signals were chosen in such a way so that their Fourier transforms are real-valued, i.e., x[k] = x[N-k]. The first row shows the DFTs of Eq. eq_FFT_DFT with its non-negative frequencies. The gray stems represent the periodic continuation to the left and to the right. The center row shows the fft with the shifted frequencies produced by fftfreq, where the two highest frequencies are shifted to the negative side. The last row depicts the one-sided rfft, which produces only the non-negative frequencies of the (two-sided) fft.
This plot illustrates the following two aspects:
For an odd number of samples (here: ), fftfreq produces an equal number of positive and negative frequencies, i.e.
[-2, -1, 0, 1, 2]. For an even number of samples (here: ), it would be valid to have either the frequencies,[-2, -1, 0, 1]or the frequencies[-1, 0, 1, 2]due to the FFT values at Hz being identical. By convention, fftfreq places the Nyquist frequency Hz on the negative side.Here, the rfft values for input lengths of are equal in spite of the input signals being different. This illustrates that the number of signal samples
Nneed to be passed to irfft to be able reconstruct the original signal, e.g.:>>> import numpy as np >>> from scipy.fft import fft, irfft, rfft ... >>> x = np.array([4, 1, 0, 1]) # n = 4 >>> X = rfft(x) >>> y0, y1 = irfft(X, n=4), irfft(X, n=5) >>> np.allclose(y0, x) True >>> len(y1) == len(x) # signals differ False >>> np.allclose(rfft(y1), rfft(x)) # one-sided FFTs are equal True
Speed Considerations
The efficiency of the FFT algorithm depends on how well the number of input samples can be factored into small prime factors. I.e., it is slowest if is prime and fastest if is a power of 2. The fft module provides the functions prev_fast_len and next_fast_len for determining adequate input lengths for fast execution.
Furthermore, the fft module provides also the context manager set_workers to set the maximum number of allowed threads when calculating the FFT. Note that some third-party FFT libraries provide SciPy backends, which can be activated by utilizing set_backend.
2- and N-D discrete Fourier transforms
The functions fft2 and ifft2 provide 2-D FFT and IFFT, respectively. Similarly, fftn and ifftn provide N-D FFT, and IFFT, respectively.
For real-input signals, similarly to rfft, we have the functions rfft2 and irfft2 for 2-D real transforms; rfftn and irfftn for N-D real transforms.
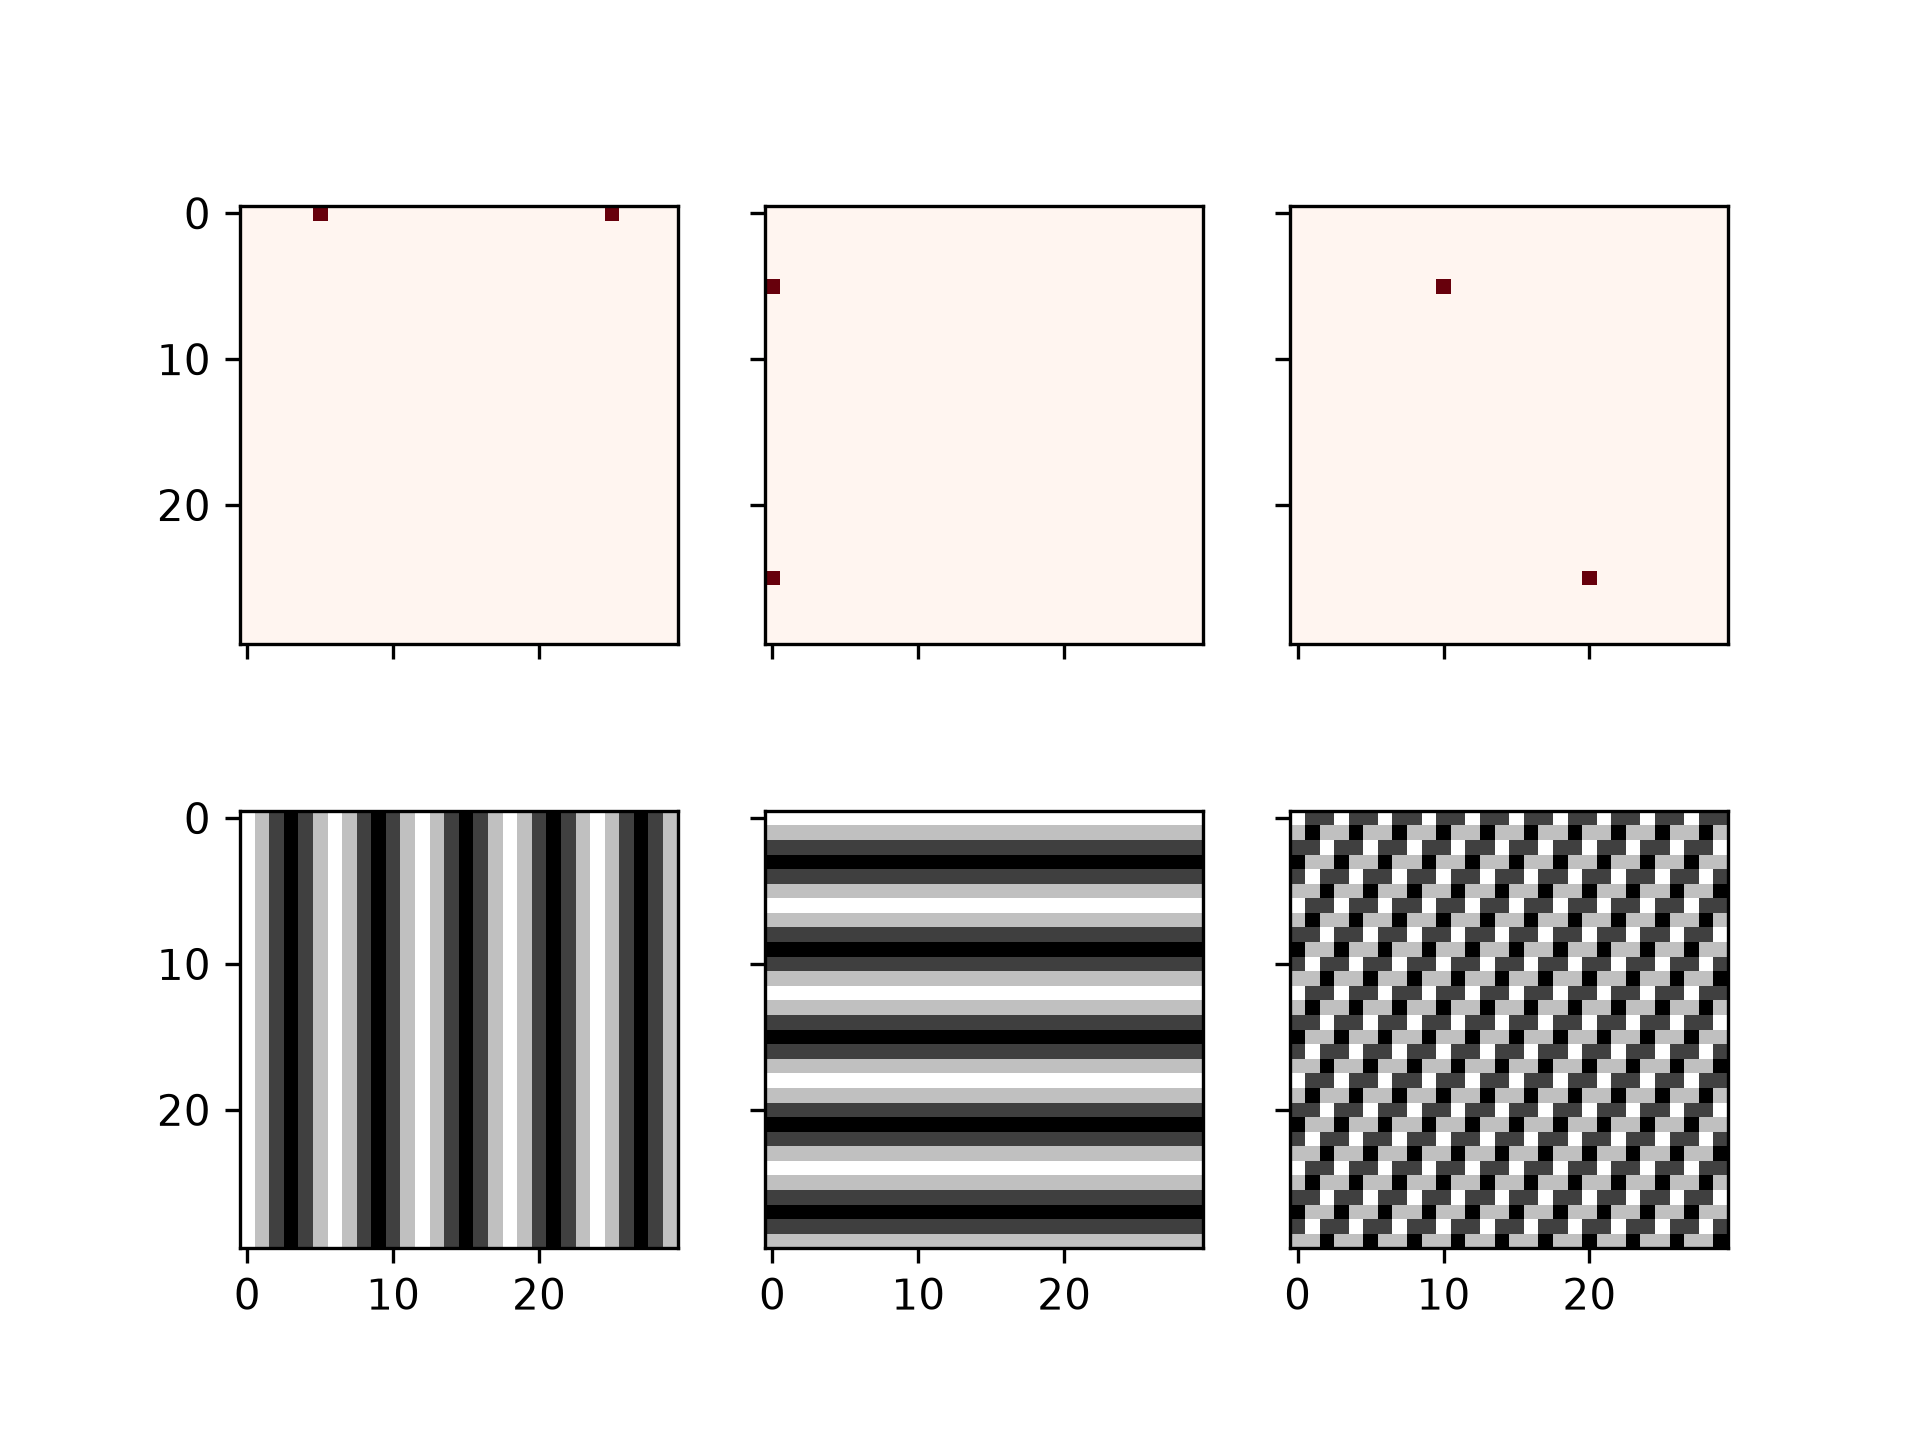
The example below demonstrates a 2-D IFFT and plots the resulting (2-D) time-domain signals.
>>> from scipy.fft import ifftn
>>> import matplotlib.pyplot as plt
>>> import matplotlib.cm as cm
>>> import numpy as np
>>> N = 30
>>> f, ((ax1, ax2, ax3), (ax4, ax5, ax6)) = plt.subplots(2, 3, sharex='col', sharey='row')
>>> xf = np.zeros((N,N))
>>> xf[0, 5] = 1
>>> xf[0, N-5] = 1
>>> Z = ifftn(xf)
>>> ax1.imshow(xf, cmap=cm.Reds)
>>> ax4.imshow(np.real(Z), cmap=cm.gray)
>>> xf = np.zeros((N, N))
>>> xf[5, 0] = 1
>>> xf[N-5, 0] = 1
>>> Z = ifftn(xf)
>>> ax2.imshow(xf, cmap=cm.Reds)
>>> ax5.imshow(np.real(Z), cmap=cm.gray)
>>> xf = np.zeros((N, N))
>>> xf[5, 10] = 1
>>> xf[N-5, N-10] = 1
>>> Z = ifftn(xf)
>>> ax3.imshow(xf, cmap=cm.Reds)
>>> ax6.imshow(np.real(Z), cmap=cm.gray)
>>> plt.show()
Discrete Cosine Transforms
SciPy provides a DCT with the function dct and a corresponding IDCT with the function idct. There are 8 types of the DCT [5] [6]; however, only the first 4 types are implemented in SciPy. "The" DCT generally refers to DCT type 2, and "the" Inverse DCT generally refers to DCT type 3. In addition, the DCT coefficients can be normalized differently (for most types, scipy provides None and ortho). Two parameters of the dct/idct function calls allow setting the DCT type and coefficient normalization.
For a single dimension array x, dct(x, norm='ortho') is equal to MATLAB's "dct(x)".
Type I DCT
SciPy uses the following definition of the unnormalized DCT-I (norm=None):
Note that the DCT-I is only supported for input size > 1.
Type II DCT
SciPy uses the following definition of the unnormalized DCT-II (norm=None):
In case of the normalized DCT (norm='ortho'), the DCT coefficients are multiplied by a scaling factor f:
In this case, the DCT "base functions" become orthonormal:
Type III DCT
SciPy uses the following definition of the unnormalized DCT-III (norm=None):
or, for norm='ortho':
Type IV DCT
SciPy uses the following definition of the unnormalized DCT-IV (norm=None):
or, for norm='ortho':
DCT and IDCT
The (unnormalized) DCT-III is the inverse of the (unnormalized) DCT-II, up to a factor of 2N. The orthonormalized DCT-III is exactly the inverse of the orthonormalized DCT- II. The function idct performs the mappings between the DCT and IDCT types, as well as the correct normalization.
The following example shows the relation between DCT and IDCT for different types and normalizations.
>>> from scipy.fft import dct, idct
>>> x = np.array([1.0, 2.0, 1.0, -1.0, 1.5])
The DCT-II and DCT-III are each other's inverses, so for an orthonormal transform we return back to the original signal.
>>> dct(dct(x, type=2, norm='ortho'), type=3, norm='ortho')
array([ 1. ,  2. ,  1. , -1. ,  1.5])
Doing the same under default normalization, however, we pick up an extra scaling factor of since the forward transform is unnormalized.
>>> dct(dct(x, type=2), type=3)
array([ 10.,  20.,  10., -10.,  15.])
For this reason, we should use the function idct using the same type for both, giving a correctly normalized result.
>>> # Normalized inverse: no scaling factor
>>> idct(dct(x, type=2), type=2)
array([ 1. ,  2. ,  1. , -1. ,  1.5])
Analogous results can be seen for the DCT-I, which is its own inverse up to a factor of .
>>> dct(dct(x, type=1, norm='ortho'), type=1, norm='ortho')
array([ 1. ,  2. ,  1. , -1. ,  1.5])
>>> # Unnormalized round-trip via DCT-I: scaling factor 2*(N-1) = 8
>>> dct(dct(x, type=1), type=1)
array([ 8. ,  16.,  8. , -8. ,  12.])
>>> # Normalized inverse: no scaling factor
>>> idct(dct(x, type=1), type=1)
array([ 1. ,  2. ,  1. , -1. ,  1.5])
And for the DCT-IV, which is also its own inverse up to a factor of .
>>> dct(dct(x, type=4, norm='ortho'), type=4, norm='ortho')
array([ 1. ,  2. ,  1. , -1. ,  1.5])
>>> # Unnormalized round-trip via DCT-IV: scaling factor 2*N = 10
>>> dct(dct(x, type=4), type=4)
array([ 10.,  20.,  10., -10.,  15.])
>>> # Normalized inverse: no scaling factor
>>> idct(dct(x, type=4), type=4)
array([ 1. ,  2. ,  1. , -1. ,  1.5])
Example
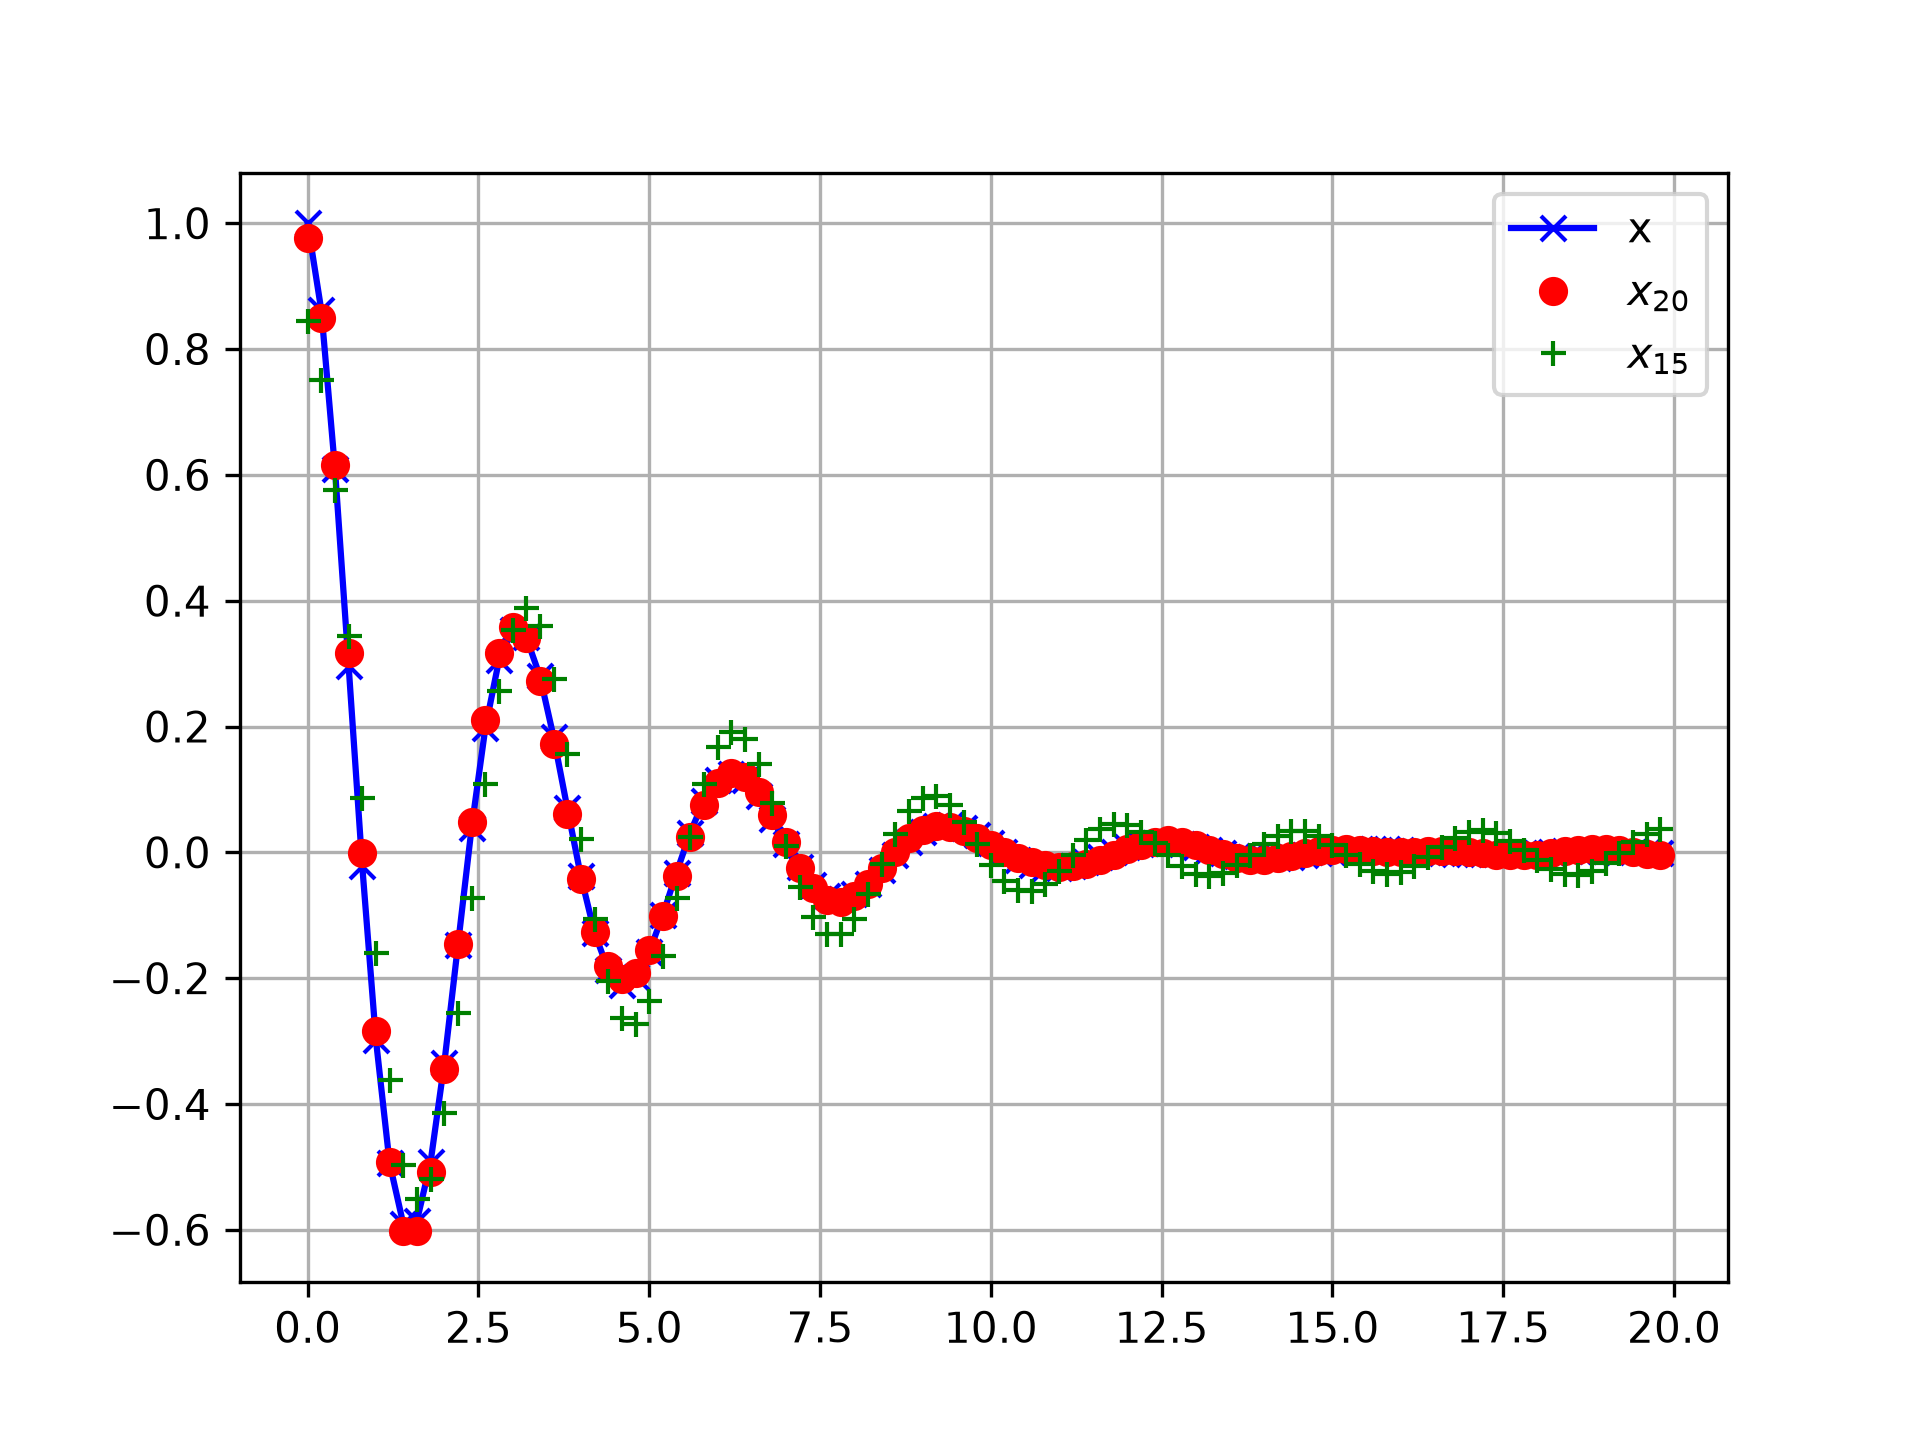
The DCT exhibits the "energy compaction property", meaning that for many signals only the first few DCT coefficients have significant magnitude. Zeroing out the other coefficients leads to a small reconstruction error, a fact which is exploited in lossy signal compression (e.g. JPEG compression).
The example below shows a signal x and two reconstructions ( and ) from the signal's DCT coefficients. The signal is reconstructed from the first 20 DCT coefficients, is reconstructed from the first 15 DCT coefficients. It can be seen that the relative error of using 20 coefficients is still very small (~0.1%), but provides a five-fold compression rate.
>>> from scipy.fft import dct, idct
>>> import matplotlib.pyplot as plt
>>> N = 100
>>> t = np.linspace(0,20,N, endpoint=False)
>>> x = np.exp(-t/3)*np.cos(2*t)
>>> y = dct(x, norm='ortho')
>>> window = np.zeros(N)
>>> window[:20] = 1
>>> yr = idct(y*window, norm='ortho')
>>> sum(abs(x-yr)**2) / sum(abs(x)**2)
0.0009872817275276098
>>> plt.plot(t, x, '-bx')
>>> plt.plot(t, yr, 'ro')
>>> window = np.zeros(N)
>>> window[:15] = 1
>>> yr = idct(y*window, norm='ortho')
>>> sum(abs(x-yr)**2) / sum(abs(x)**2)
0.06196643004256714
>>> plt.plot(t, yr, 'g+')
>>> plt.legend(['x', '$x_{20}$', '$x_{15}$'])
>>> plt.grid()
>>> plt.show()
Discrete Sine Transforms
SciPy provides a DST [6] with the function dst and a corresponding IDST with the function idst.
There are, theoretically, 8 types of the DST for different combinations of even/odd boundary conditions and boundary offsets [7], only the first 4 types are implemented in SciPy.
Type I DST
DST-I assumes the input is odd around n=-1 and n=N. SciPy uses the following definition of the unnormalized DST-I (norm=None):
Note also that the DST-I is only supported for input size > 1. The (unnormalized) DST-I is its own inverse, up to a factor of 2(N+1).
Type II DST
DST-II assumes the input is odd around n=-1/2 and even around n=N. SciPy uses the following definition of the unnormalized DST-II (norm=None):
Type III DST
DST-III assumes the input is odd around n=-1 and even around n=N-1. SciPy uses the following definition of the unnormalized DST-III (norm=None):
Type IV DST
SciPy uses the following definition of the unnormalized DST-IV (norm=None):
or, for norm='ortho':
DST and IDST
The following example shows the relation between DST and IDST for different types and normalizations.
>>> from scipy.fft import dst, idst
>>> x = np.array([1.0, 2.0, 1.0, -1.0, 1.5])
The DST-II and DST-III are each other's inverses, so for an orthonormal transform we return back to the original signal.
>>> dst(dst(x, type=2, norm='ortho'), type=3, norm='ortho')
array([ 1. ,  2. ,  1. , -1. ,  1.5])
Doing the same under default normalization, however, we pick up an extra scaling factor of since the forward transform is unnormalized.
>>> dst(dst(x, type=2), type=3)
array([ 10.,  20.,  10., -10.,  15.])
For this reason, we should use the function idst using the same type for both, giving a correctly normalized result.
>>> idst(dst(x, type=2), type=2)
array([ 1. ,  2. ,  1. , -1. ,  1.5])
Analogous results can be seen for the DST-I, which is its own inverse up to a factor of .
>>> dst(dst(x, type=1, norm='ortho'), type=1, norm='ortho')
array([ 1. ,  2. ,  1. , -1. ,  1.5])
>>>  # scaling factor 2*(N+1) = 12
>>> dst(dst(x, type=1), type=1)
array([ 12.,  24.,  12., -12.,  18.])
>>>  # no scaling factor
>>> idst(dst(x, type=1), type=1)
array([ 1. ,  2. ,  1. , -1. ,  1.5])
And for the DST-IV, which is also its own inverse up to a factor of .
>>> dst(dst(x, type=4, norm='ortho'), type=4, norm='ortho')
array([ 1. ,  2. ,  1. , -1. ,  1.5])
>>>  # scaling factor 2*N = 10
>>> dst(dst(x, type=4), type=4)
array([ 10.,  20.,  10., -10.,  15.])
>>>  # no scaling factor
>>> idst(dst(x, type=4), type=4)
array([ 1. ,  2. ,  1. , -1. ,  1.5])
Fast Hankel Transform
SciPy provides the functions fht and ifht to perform the Fast Hankel Transform (FHT) and its inverse (IFHT) on logarithmically-spaced input arrays.
The FHT is the discretized version of the continuous Hankel transform defined by [8]
with the Bessel function of order . Under a change of variables , , this becomes
which is a convolution in logarithmic space. The FHT algorithm uses the FFT to perform this convolution on discrete input data.
Care must be taken to minimise numerical ringing due to the circular nature of FFT convolution. To ensure that the low-ringing condition [8] holds, the output array can be slightly shifted by an offset computed using the fhtoffset function.
References
Cooley, James W., and John W. Tukey, 1965, "An algorithm for the machine calculation of complex Fourier series," Math. Comput. 19: 297-301.
Press, W., Teukolsky, S., Vetterline, W.T., and Flannery, B.P., 2007, Numerical Recipes: The Art of Scientific Computing, ch. 12-13. Cambridge Univ. Press, Cambridge, UK.
"Discrete Fourier transform", Wikipedia, https://en.wikipedia.org/wiki/Discrete_Fourier_transform
"Discrete-time Fourier transform", Wikipedia, https://en.wikipedia.org/wiki/Discrete-time_Fourier_transform
"Discrete cosine transform", Wikipedia, https://en.wikipedia.org/wiki/Discrete_cosine_transform
IEEE Transactions on acoustics, speech and signal processing vol. 28(1), pp. 27-34, 10.1109/TASSP.1980.1163351
"Discrete sine transform", Wikipedia, https://en.wikipedia.org/wiki/Discrete_sine_transform
spectrum", MNRAS, 312, 257. 10.1046/j.1365-8711.2000.03071.x