bundles / scipy 2.0.0.dev0+git20260907.41eeb59 / scipy / datasets / _fetchers / electrocardiogram
function
scipy.datasets._fetchers:electrocardiogram
source: build-install/usr/lib/python3.14/site-packages/scipy/datasets/_fetchers.py:83
Signature
def electrocardiogram()Summary
Load an electrocardiogram as an example for a 1-D signal.
Extended Summary
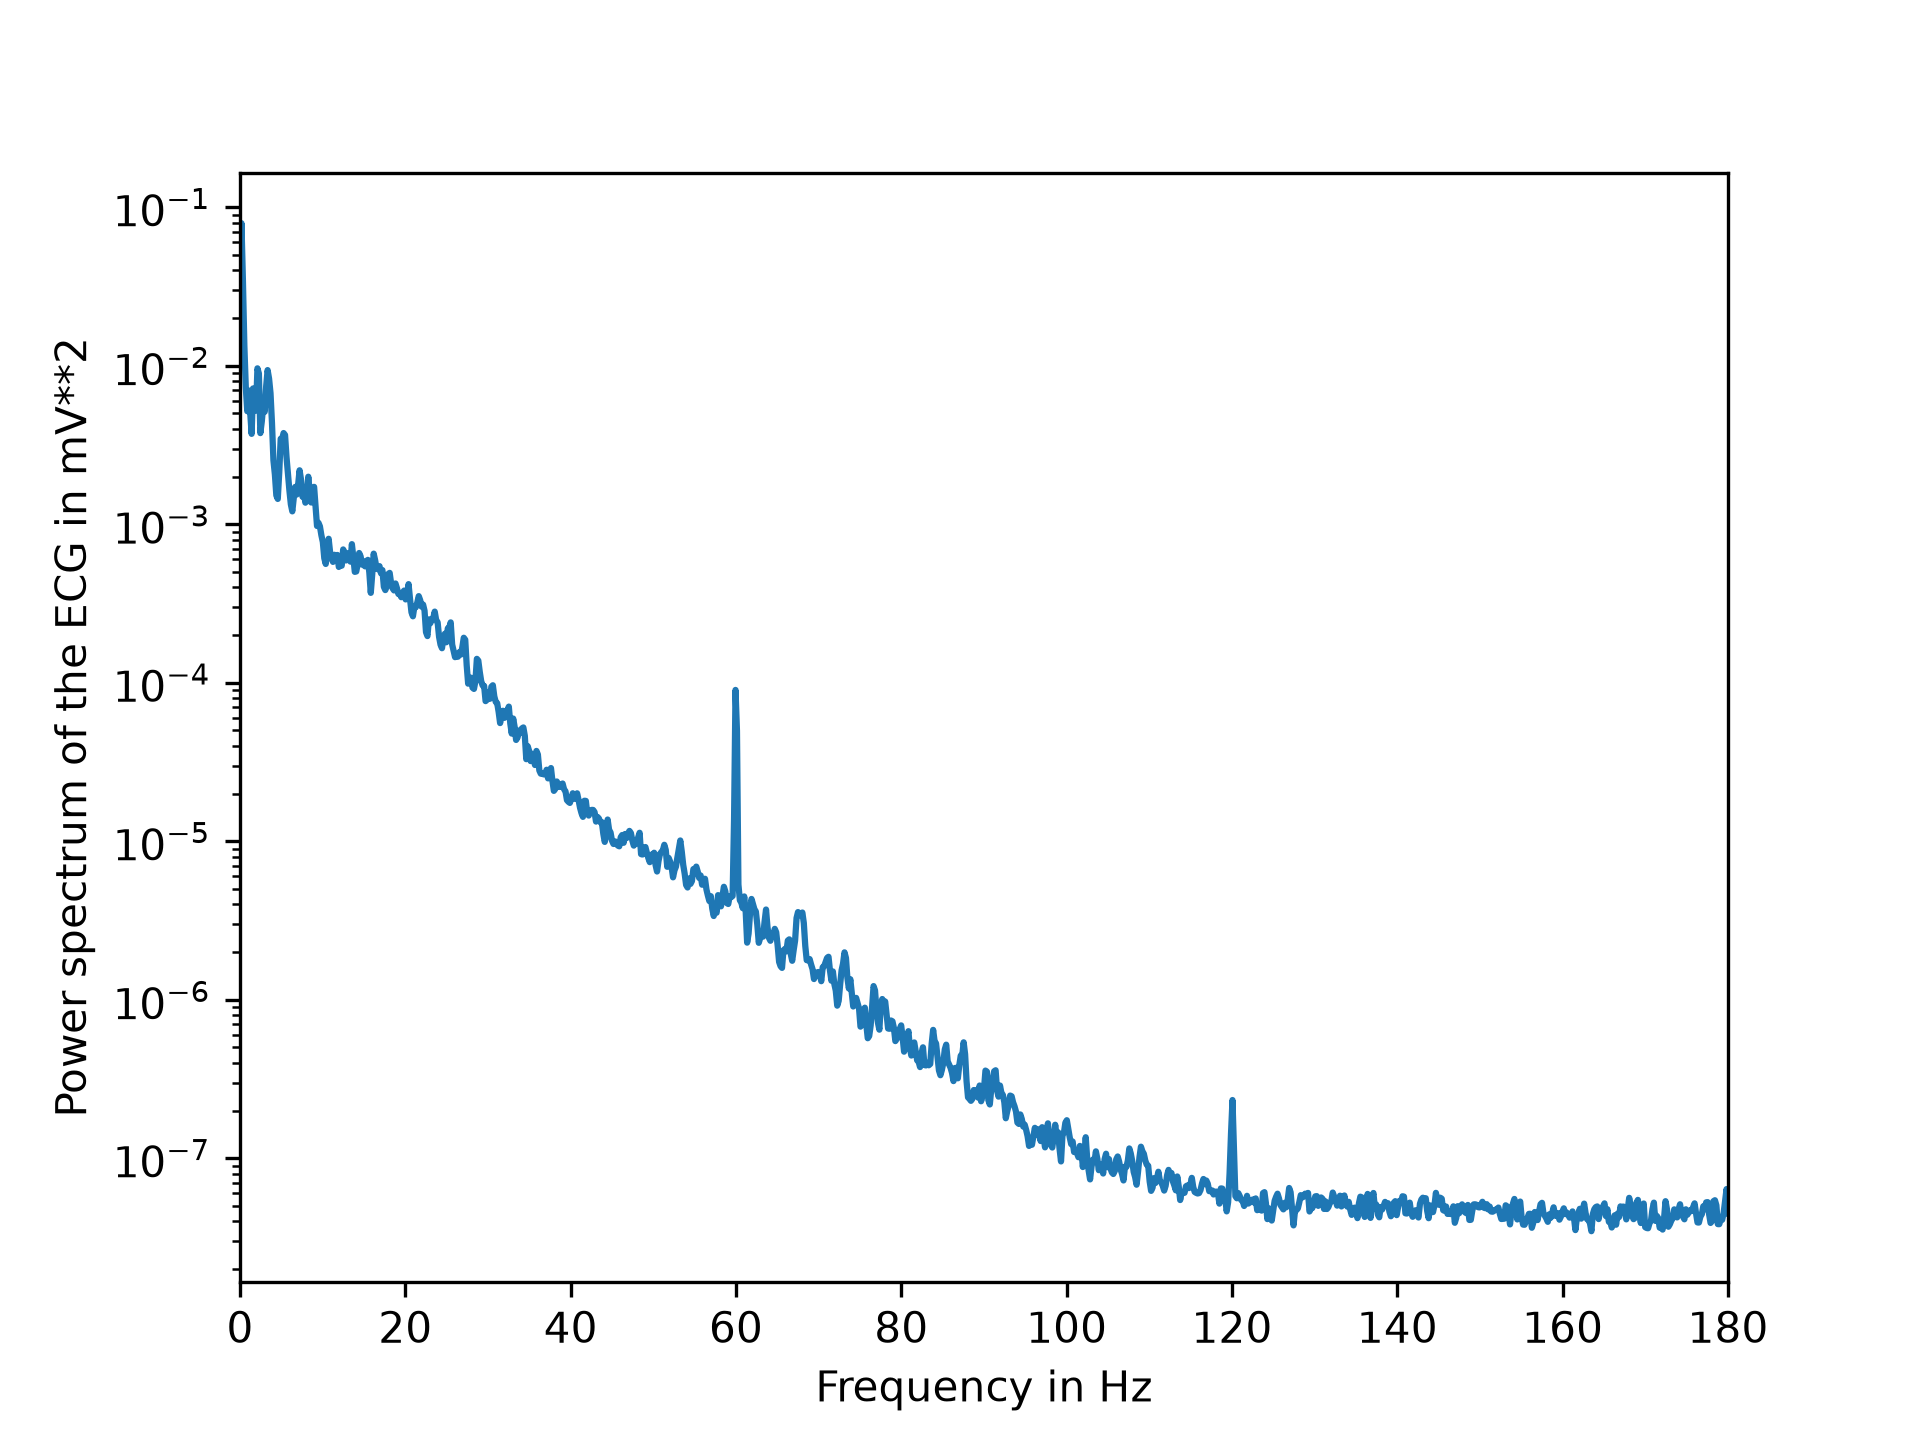
The returned signal is a 5 minute long electrocardiogram (ECG), a medical recording of the heart's electrical activity, sampled at 360 Hz.
Returns
ecg: ndarrayThe electrocardiogram in millivolt (mV) sampled at 360 Hz.
Notes
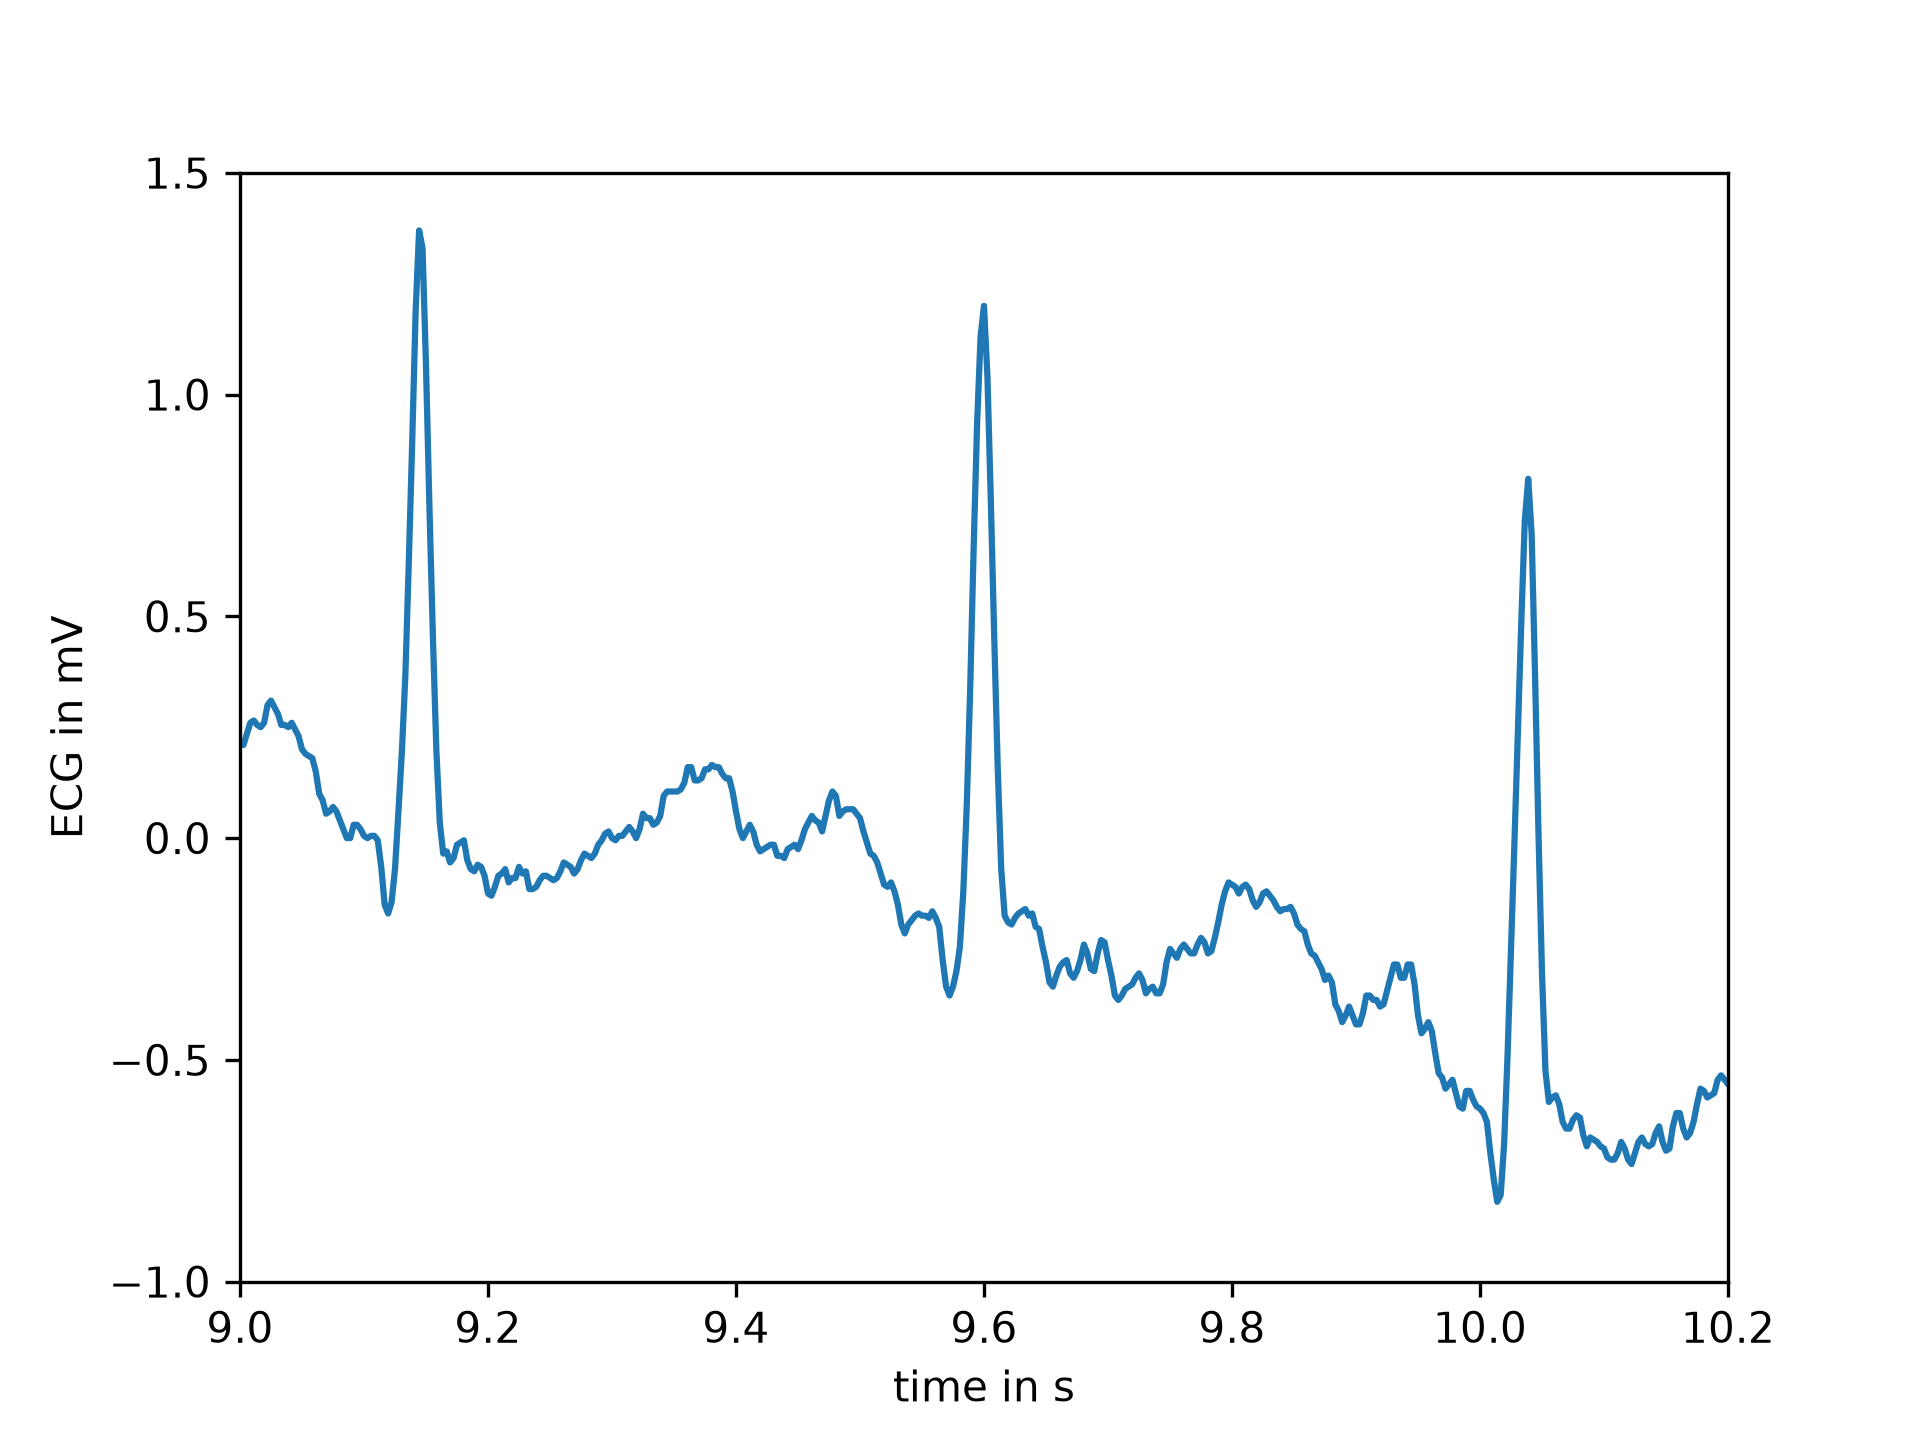
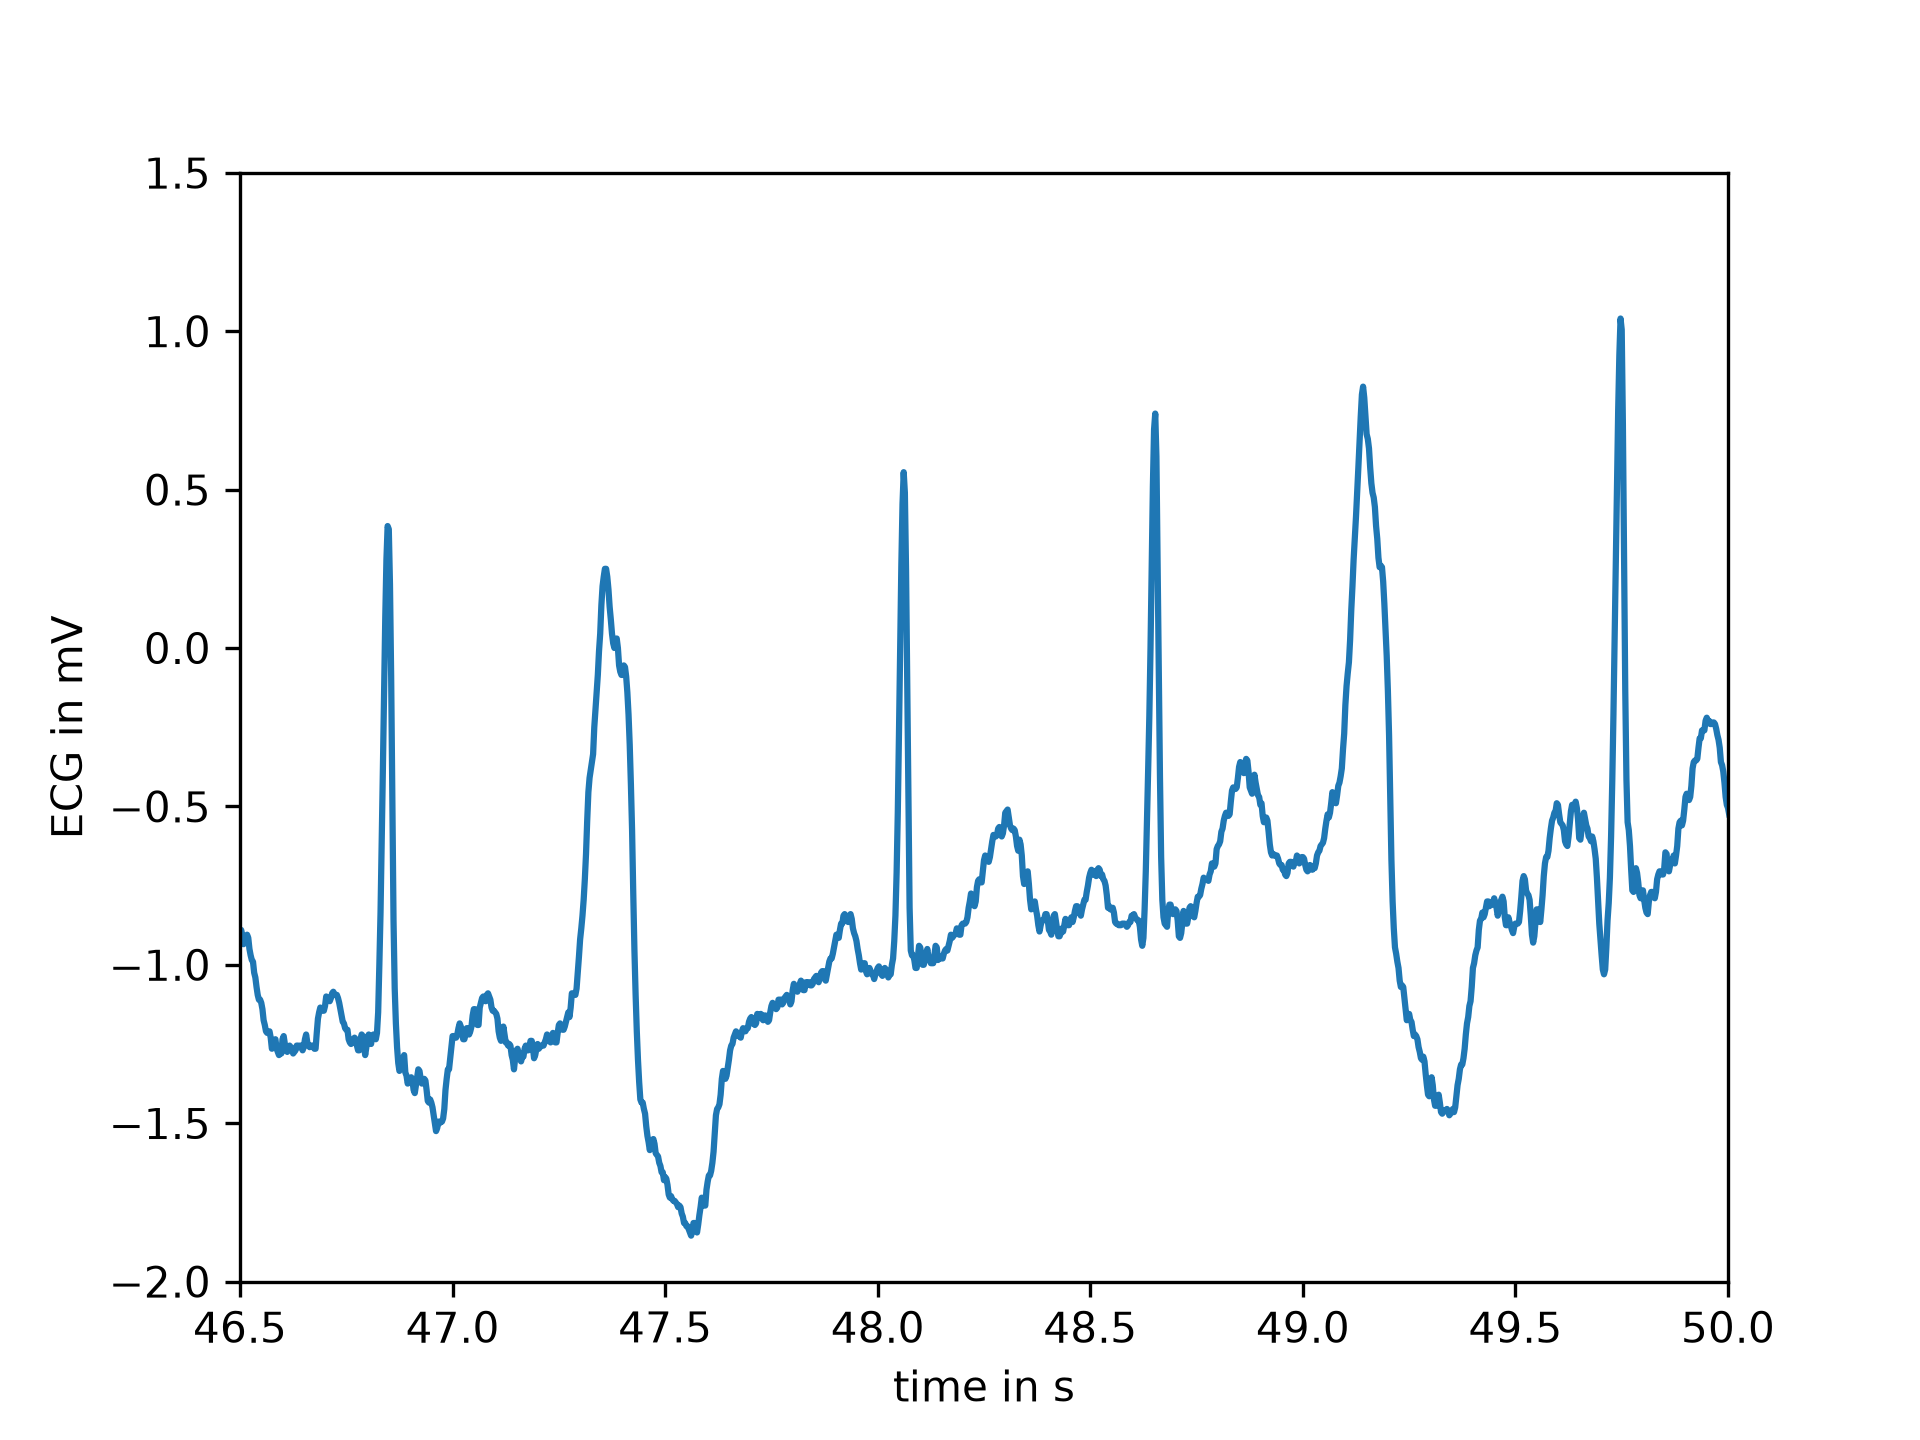
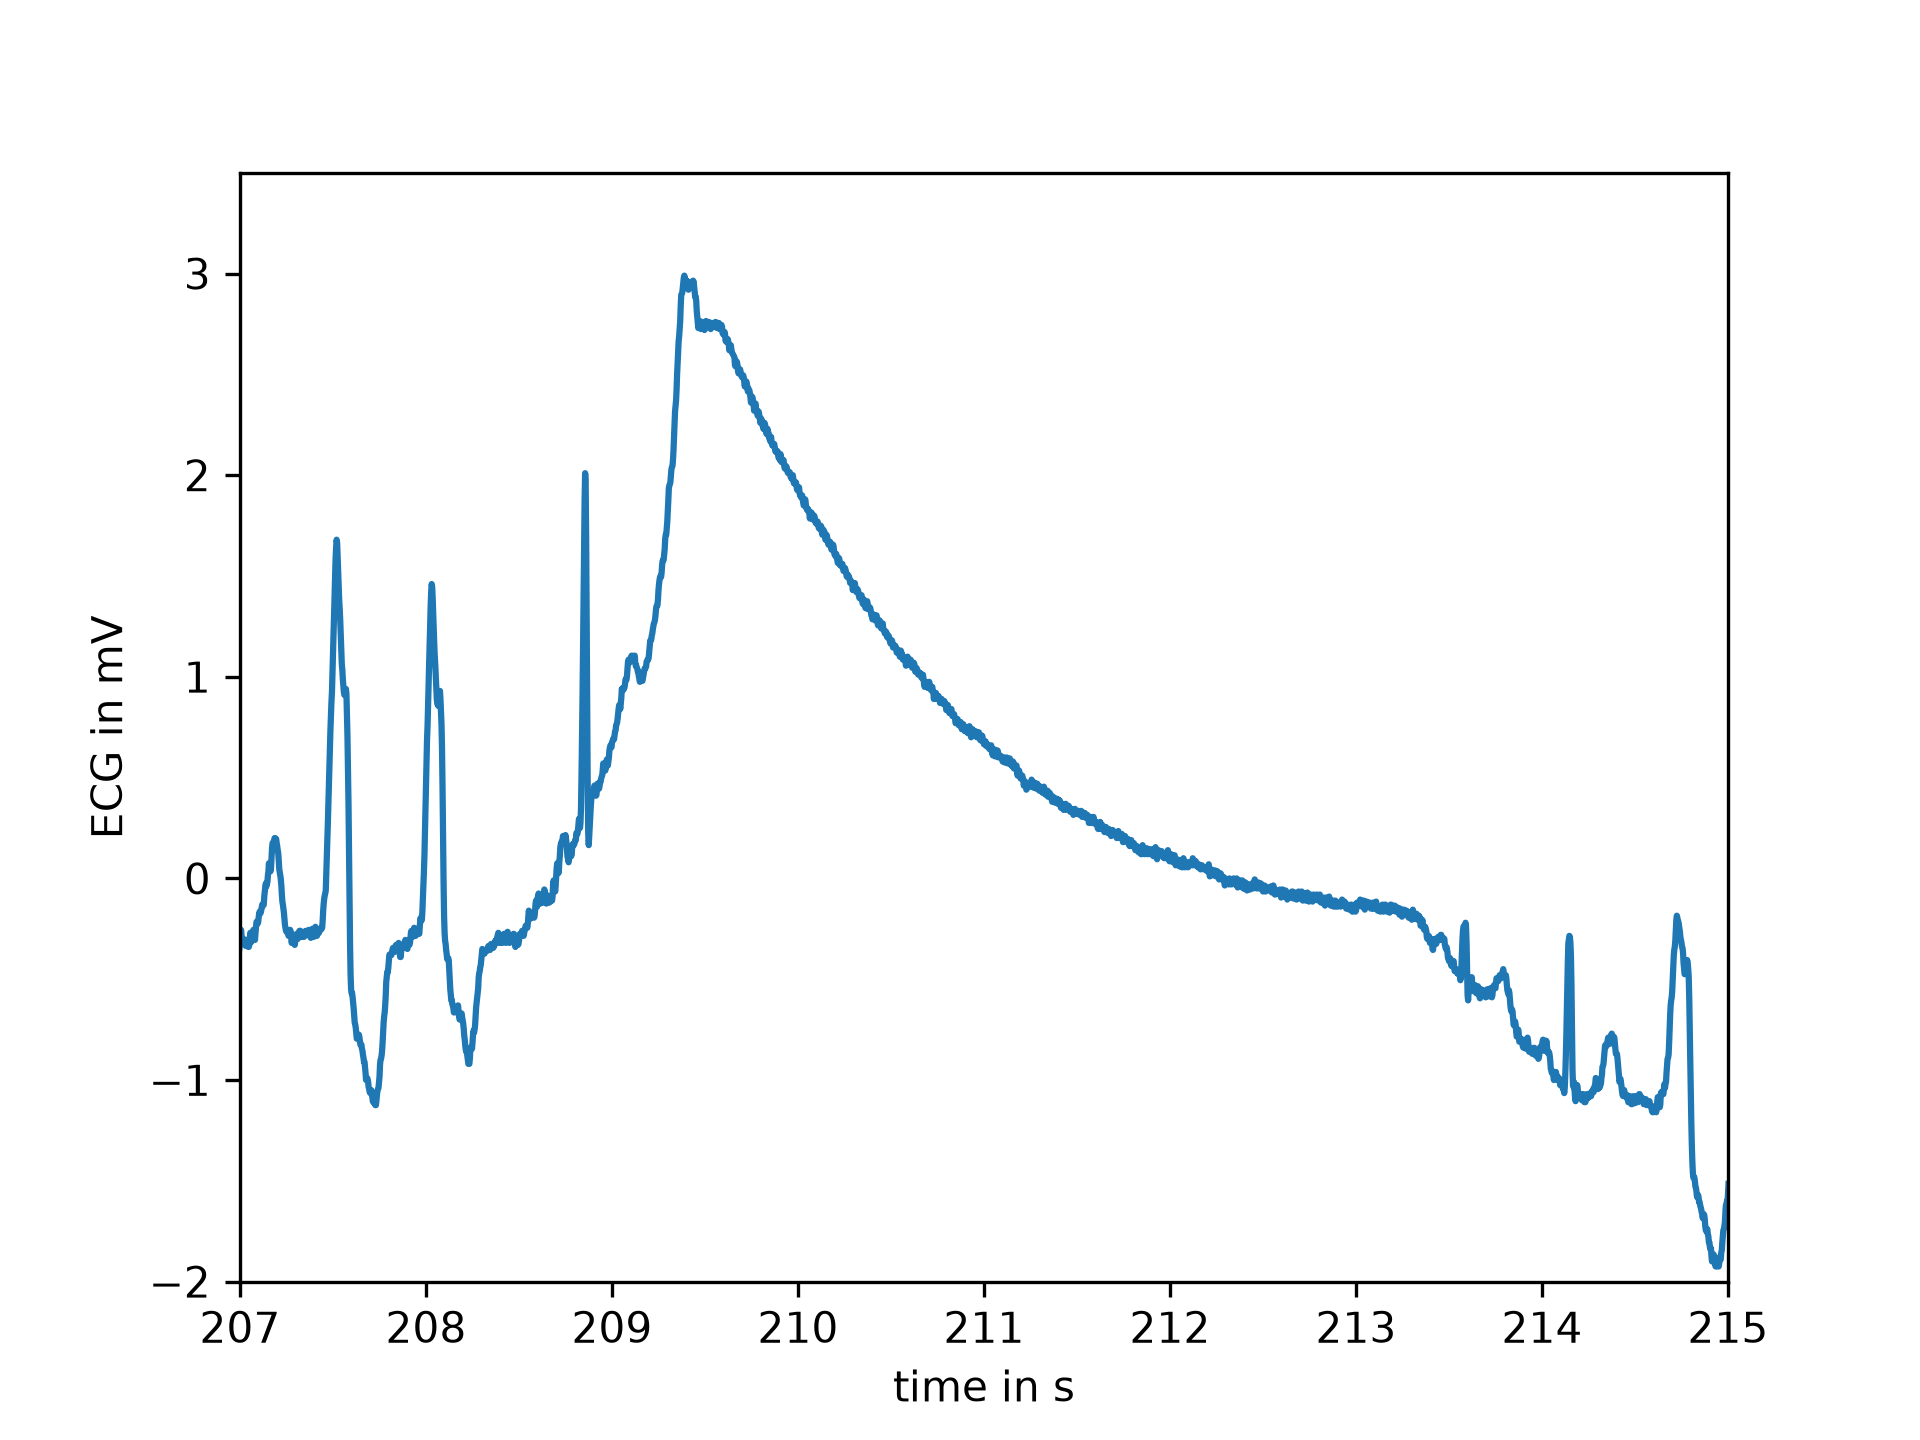
The provided signal is an excerpt (19:35 to 24:35) from the record 208 (lead MLII) provided by the MIT-BIH Arrhythmia Database [1] on PhysioNet [2]. The excerpt includes noise induced artifacts, typical heartbeats as well as pathological changes.
Array API Standard Support
electrocardiogram is not in-scope for support of Python Array API Standard compatible backends other than NumPy.
See dev-arrayapi for more information.
Examples
from scipy.datasets import electrocardiogram
ecg = electrocardiogram()
✓
ecg
ecg.shape, ecg.mean(), ecg.std()
✗
((108000,), np.float64(-0.16510875), np.float64(0.5992473991177295))As stated the signal features several areas with a different morphology. E.g., the first few seconds show the electrical activity of a heart in normal sinus rhythm as seen below.
import numpy as np
import matplotlib.pyplot as plt
fs = 360
time = np.arange(ecg.size) / fs
✓
plt.plot(time, ecg)
plt.xlabel("time in s")
plt.ylabel("ECG in mV")
plt.xlim(9, 10.2)
plt.ylim(-1, 1.5)
✗
(-1.0, 1.5)
plt.show()
✓
plt.plot(time, ecg)
plt.xlabel("time in s")
plt.ylabel("ECG in mV")
plt.xlim(46.5, 50)
plt.ylim(-2, 1.5)
✗
(-2.0, 1.5)
plt.show()
✓
plt.plot(time, ecg)
plt.xlabel("time in s")
plt.ylabel("ECG in mV")
plt.xlim(207, 215)
plt.ylim(-2, 3.5)
✗
(-2.0, 3.5)
plt.show()
✓
from scipy.signal import welch
f, Pxx = welch(ecg, fs=fs, nperseg=2048, scaling="spectrum")
✓
plt.semilogy(f, Pxx)
plt.xlabel("Frequency in Hz")
plt.ylabel("Power spectrum of the ECG in mV**2")
plt.xlim(f[[0, -1]])
✗
(0.0, 180.0)
plt.show()
✓
Aliases
scipy.datasets.electrocardiogram