bundles / scipy 2.0.0.dev0+git20260907.41eeb59 / scipy / interpolate / _polyint / approximate_taylor_polynomial
function
scipy.interpolate._polyint:approximate_taylor_polynomial
source: build-install/usr/lib/python3.14/site-packages/scipy/interpolate/_polyint.py:464
Signature
def approximate_taylor_polynomial(f, x, degree, scale, order = None)Summary
Estimate the Taylor polynomial of f at x by polynomial fitting.
Extended Summary
Parameters
f: callableThe function whose Taylor polynomial is sought. Should accept a vector of
xvalues.x: scalarThe point at which the polynomial is to be evaluated.
degree: intThe degree of the Taylor polynomial
scale: scalarThe width of the interval to use to evaluate the Taylor polynomial. Function values spread over a range this wide are used to fit the polynomial. Must be chosen carefully.
order: int or None, optionalThe order of the polynomial to be used in the fitting;
fwill be evaluatedorder+1times. If None, usedegree.
Returns
p: poly1d instanceThe Taylor polynomial (translated to the origin, so that for example p(0)=f(x)).
Notes
The appropriate choice of "scale" is a trade-off; too large and the function differs from its Taylor polynomial too much to get a good answer, too small and round-off errors overwhelm the higher-order terms. The algorithm used becomes numerically unstable around order 30 even under ideal circumstances.
Choosing order somewhat larger than degree may improve the higher-order terms.
Array API Standard Support
approximate_taylor_polynomial is not in-scope for support of Python Array API Standard compatible backends other than NumPy.
See dev-arrayapi for more information.
Examples
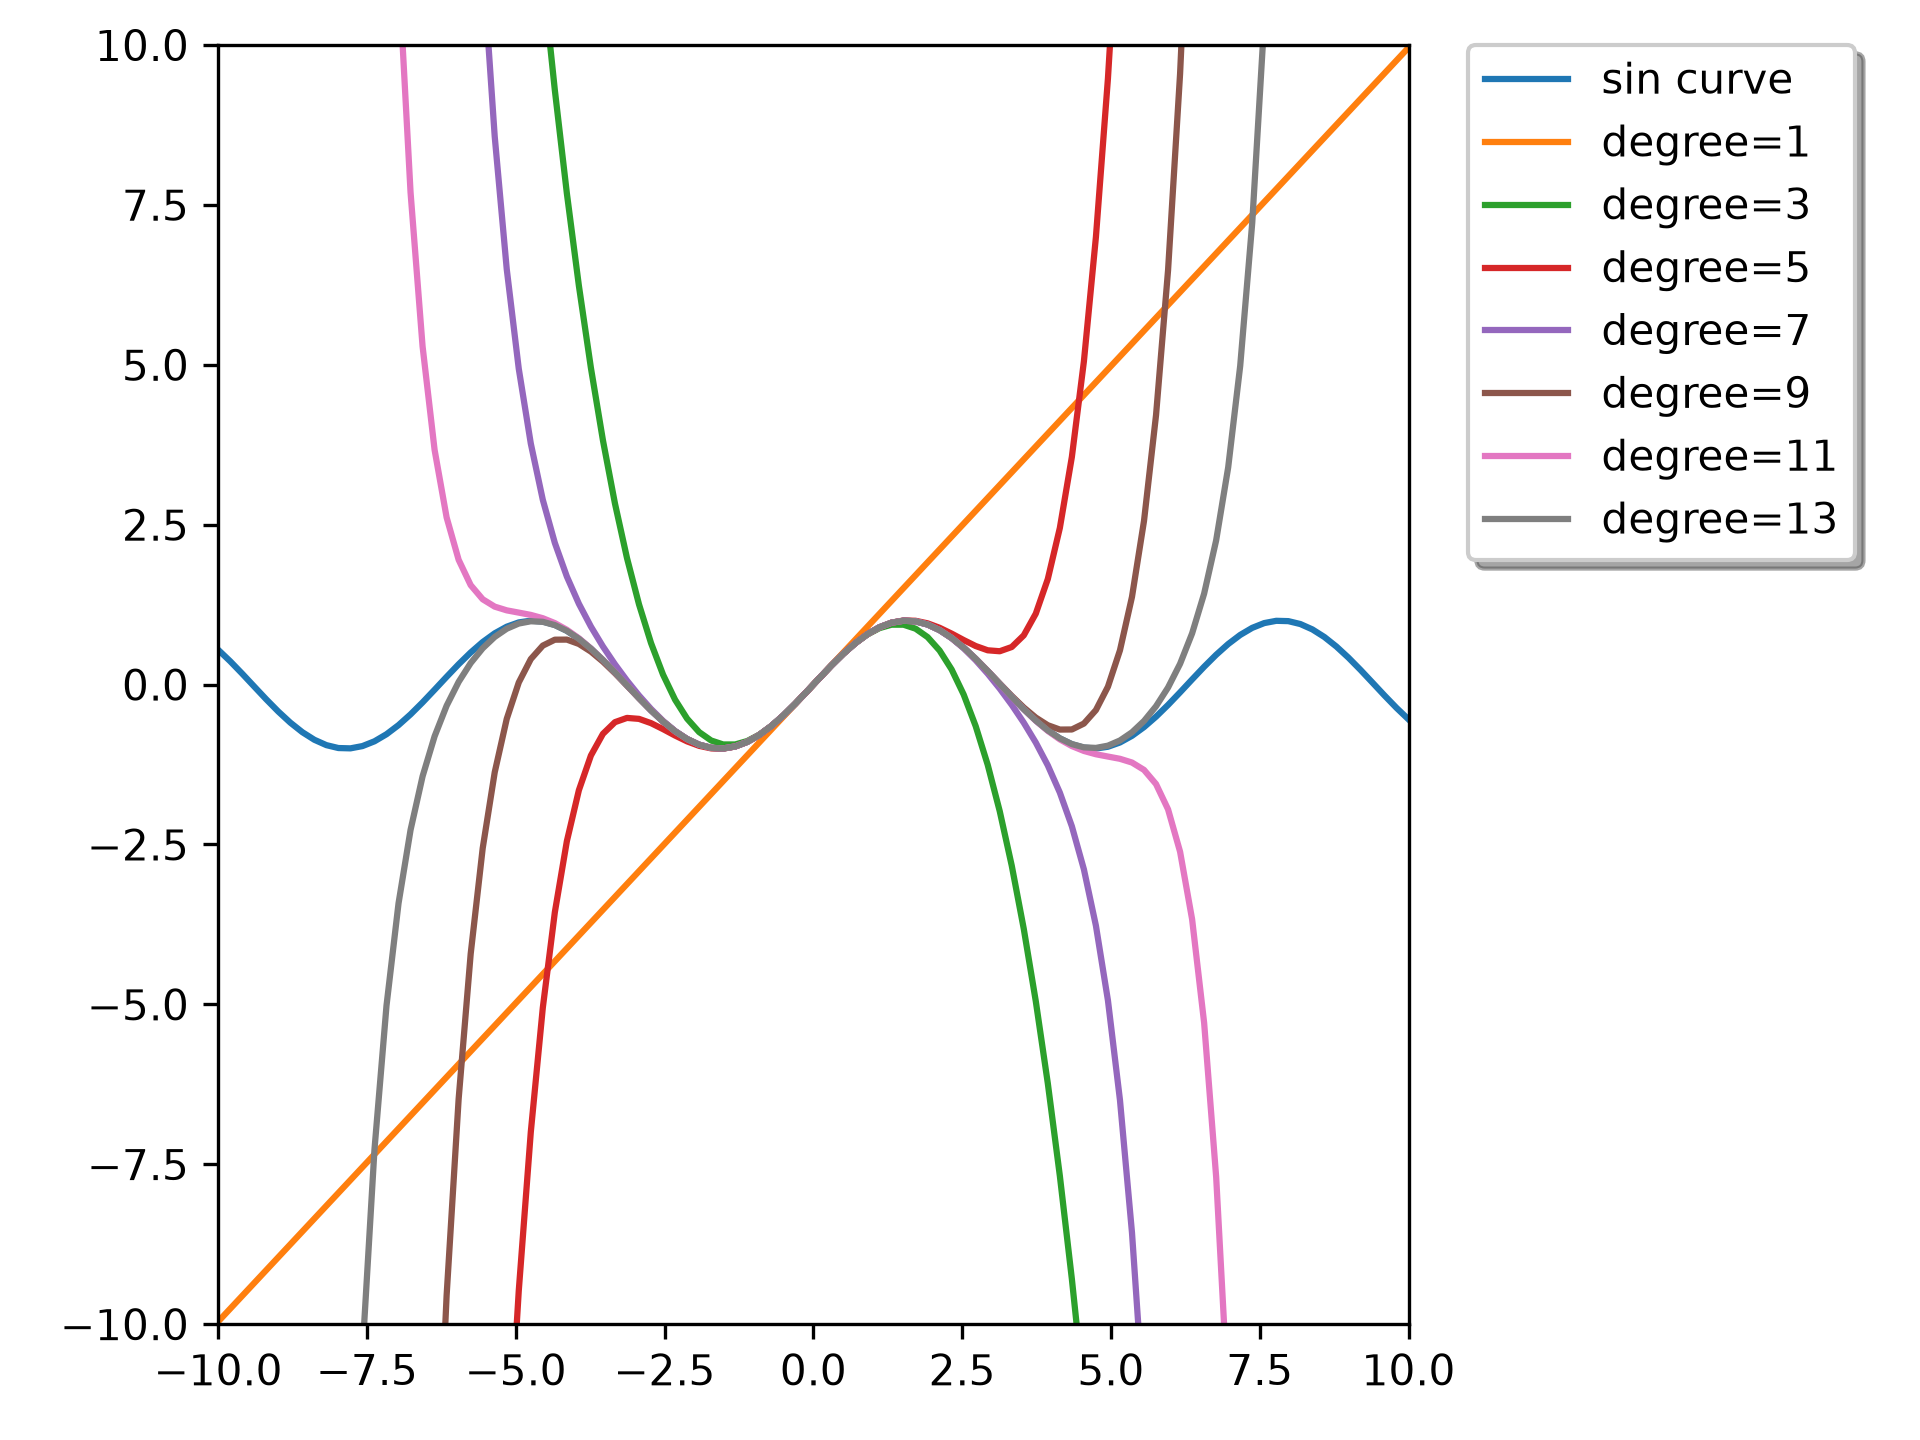
We can calculate Taylor approximation polynomials of sin function with various degrees:import numpy as np import matplotlib.pyplot as plt from scipy.interpolate import approximate_taylor_polynomial x = np.linspace(-10.0, 10.0, num=100)✓
plt.plot(x, np.sin(x), label="sin curve")
for degree in np.arange(1, 15, step=2):
    sin_taylor = approximate_taylor_polynomial(np.sin, 0, degree, 1,
                                               order=degree + 2)
    plt.plot(x, sin_taylor(x), label=f"degree={degree}")
plt.legend(bbox_to_anchor=(1.05, 1), loc='upper left',
           borderaxespad=0.0, shadow=True)
✗
<matplotlib.legend.Legend object at 0x7f3f60b42a50>
plt.tight_layout()
✓plt.axis([-10, 10, -10, 10])
✗(np.float64(-10.0), np.float64(10.0), np.float64(-10.0), np.float64(10.0))
plt.show()
✓
Aliases
scipy.interpolate.approximate_taylor_polynomial