bundles / scipy 2.0.0.dev0+git20260907.41eeb59 / scipy / signal / _spectral_py / csd
function
scipy.signal._spectral_py:csd
source: build-install/usr/lib/python3.14/site-packages/scipy/signal/_spectral_py.py:677
Signature
def csd(x, y, fs = 1.0, window = hann_periodic, nperseg = None, noverlap = None, nfft = None, detrend = constant, return_onesided = True, scaling = density, axis = -1, average = mean)Summary
Estimate the cross power spectral density, Pxy, using Welch's method.
Parameters
x: array_likeTime series of measurement values
y: array_likeTime series of measurement values
fs: float, optionalSampling frequency of the
xandytime series. Defaults to 1.0.window: str or tuple or array_like, optionalDesired window to use. If
windowis a string or tuple, it is passed to get_window to generate the window values, which are DFT-even by default. See get_window for a list of windows and required parameters. Ifwindowis array_like it will be used directly as the window and its length must be nperseg. Defaults to a periodic Hann window.nperseg: int, optionalLength of each segment. Defaults to None, but if window is str or tuple, is set to 256, and if window is array_like, is set to the length of the window.
noverlap: int, optionalNumber of points to overlap between segments. If None,
noverlap = nperseg // 2. Defaults to None and may not be greater thannperseg.nfft: int, optionalLength of the FFT used, if a zero padded FFT is desired. If None, the FFT length is
nperseg. Defaults to None.detrend: str or function or `False`, optionalSpecifies how to detrend each segment. If
detrendis a string, it is passed as the type argument to thedetrendfunction. If it is a function, it takes a segment and returns a detrended segment. Ifdetrendis False, no detrending is done. Defaults to 'constant'.return_onesided: bool, optionalIf True, return a one-sided spectrum for real data. If False return a two-sided spectrum. Defaults to True, but for complex data, a two-sided spectrum is always returned.
scaling: { 'density', 'spectrum' }, optionalSelects between computing the cross spectral density ('density') where Pxy has units of V**2/Hz and computing the cross spectrum ('spectrum') where Pxy has units of V**2, if
xandyare measured in V andfsis measured in Hz. Defaults to 'density'axis: int, optionalAxis along which the CSD is computed for both inputs; the default is over the last axis (i.e.
axis=-1).average: { 'mean', 'median' }, optionalMethod to use when averaging periodograms. If the spectrum is complex, the average is computed separately for the real and imaginary parts. Defaults to 'mean'.
Returns
f: ndarrayArray of sample frequencies.
Pxy: ndarrayCross spectral density or cross power spectrum of x,y.
Notes
By convention, Pxy is computed with the conjugate FFT of X multiplied by the FFT of Y.
If the input series differ in length, the shorter series will be zero-padded to match.
An appropriate amount of overlap will depend on the choice of window and on your requirements. For the default Hann window an overlap of 50% is a reasonable trade-off between accurately estimating the signal power, while not over counting any of the data. Narrower windows may require a larger overlap.
The ratio of the cross spectrum (scaling='spectrum') divided by the cross spectral density (scaling='density') is the constant factor of sum(abs(window)**2)*fs / abs(sum(window))**2. If return_onesided is True, the values of the negative frequencies are added to values of the corresponding positive ones.
Consult the tutorial_SpectralAnalysis section of the user_guide for a discussion of the scalings of a spectral density and an (amplitude) spectrum.
Welch's method may be interpreted as taking the average over the time slices of a (cross-) spectrogram. Internally, this function utilizes the ShortTimeFFT to determine the required (cross-) spectrogram. An example below illustrates that it is straightforward to calculate Pxy directly with the ShortTimeFFT. However, there are some notable differences in the behavior of the ShortTimeFFT:
There is no direct ShortTimeFFT equivalent for the csd parameter combination
return_onesided=True, scaling='density', sincefft_mode='onesided2X'requires'psd'scaling. The is due to csd returning the doubled squared magnitude in this case, which does not have a sensible interpretation.ShortTimeFFT uses
float64/complex128internally, which is due to the behavior of the utilized fft module. Thus, those are the dtypes being returned. The csd function casts the return values tofloat32/complex64if the input isfloat32/complex64as well.The csd function calculates
np.conj(Sx[q,p]) * Sy[q,p], whereas spectrogram calculatesSx[q,p] * np.conj(Sy[q,p])whereSx[q,p],Sy[q,p]are the STFTs ofxandy. Also, the window positioning is different.
Examples
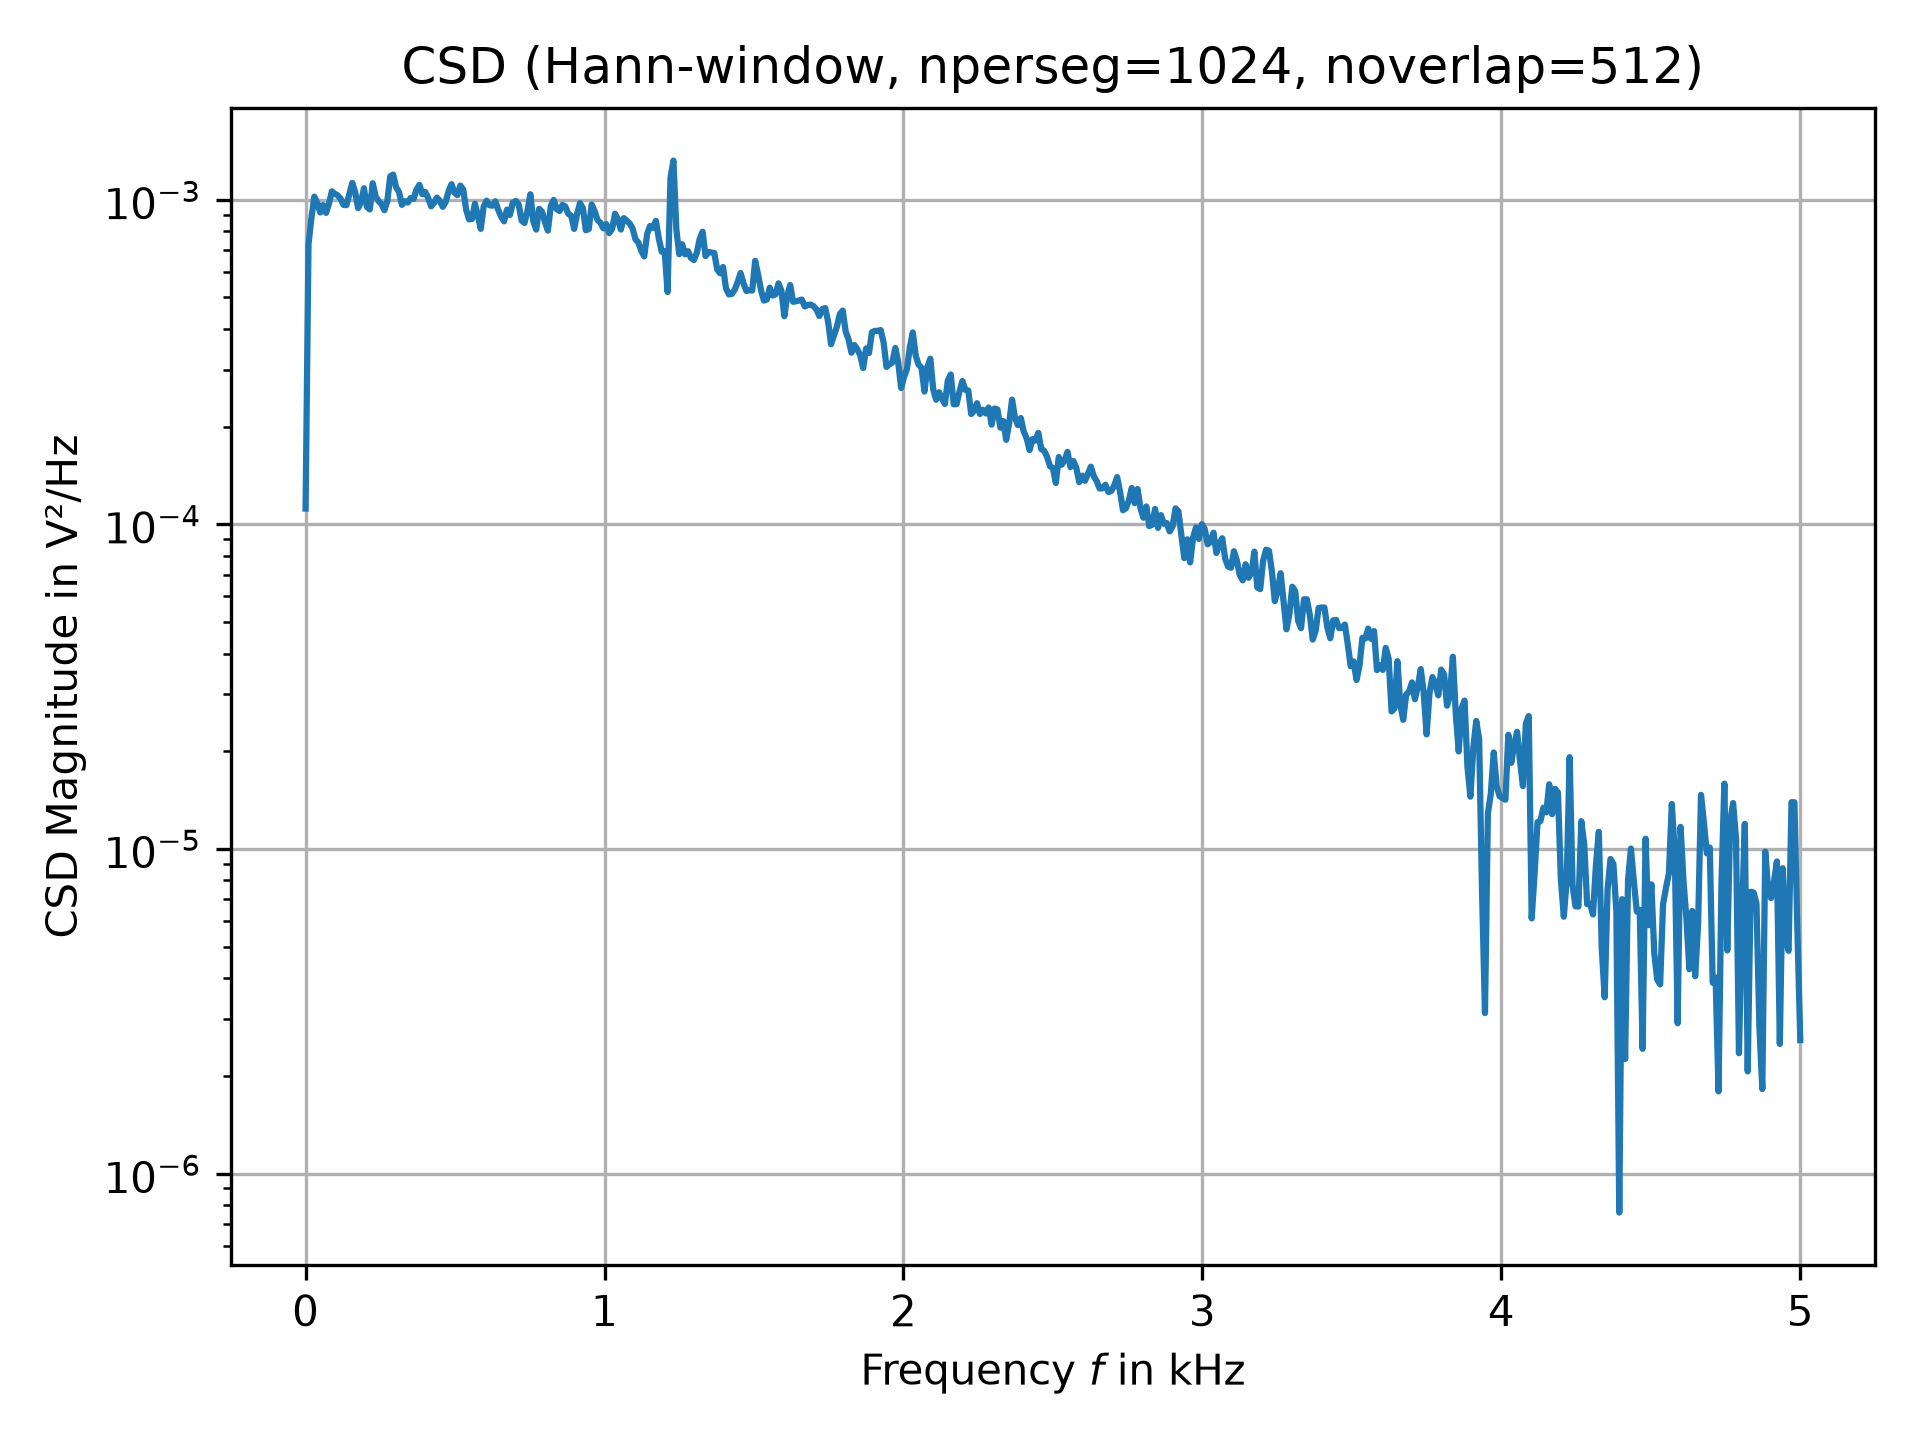
The following example plots the cross power spectral density of two signals with some common features:import numpy as np from scipy import signal import matplotlib.pyplot as plt rng = np.random.default_rng() # Generate two test signals with some common features: N, fs = 100_000, 10e3 # number of samples and sampling frequency amp, freq = 20, 1234.0 # amplitude and frequency of utilized sine signal noise_power = 0.001 * fs / 2 time = np.arange(N) / fs b, a = signal.butter(2, 0.25, 'low') x = rng.normal(scale=np.sqrt(noise_power), size=time.shape) y = signal.lfilter(b, a, x) x += amp*np.sin(2*np.pi*freq*time) y += rng.normal(scale=0.1*np.sqrt(noise_power), size=time.shape) # Compute and plot the magnitude of the cross spectral density: nperseg, noverlap, win = 1024, 512, 'hann' f, Pxy = signal.csd(x, y, fs, win, nperseg, noverlap) fig0, ax0 = plt.subplots(tight_layout=True)✓
ax0.set_title(f"CSD ({win.title()}-window, {nperseg=}, {noverlap=})")
ax0.set(xlabel="Frequency $f$ in kHz", ylabel="CSD Magnitude in V²/Hz")
ax0.semilogy(f/1e3, np.abs(Pxy))
✗
[<matplotlib.lines.Line2D object at 0x7f3f686d3380>]
ax0.grid()
plt.show()
✓
SFT = signal.ShortTimeFFT.from_window('hann', fs, nperseg, noverlap,
                                      scale_to='psd', fft_mode='onesided2X',
                                      phase_shift=None)
Sxy1 = SFT.spectrogram(y, x, detr='constant', k_offset=nperseg//2,
                       p0=0, p1=(N-noverlap) // SFT.hop)
Pxy1 = Sxy1.mean(axis=-1)
np.allclose(Pxy, Pxy1)  # same result as with csd()
✓
TrueAs discussed in the Notes section, the results of using an approach analogous to the code snippet above and the `csd` function may deviate due to implementation details. Note that the code snippet above can be easily adapted to determine other statistical properties than the mean value.
See also
- coherence
Magnitude squared coherence by Welch's method.
- lombscargle
Lomb-Scargle periodogram for unevenly sampled data
- periodogram
Simple, optionally modified periodogram
- welch
Power spectral density by Welch's method. [Equivalent to csd(x,x)]
Aliases
scipy.signal.csd