bundles / scipy 2.0.0.dev0+git20260907.41eeb59 / scipy / signal / _spline_filters / qspline1d_eval
function
scipy.signal._spline_filters:qspline1d_eval
source: build-install/usr/lib/python3.14/site-packages/scipy/signal/_spline_filters.py:611
Signature
def qspline1d_eval(cj, newx, dx = 1.0, x0 = 0)Summary
Evaluate a quadratic spline at the new set of points.
Parameters
cj: ndarrayQuadratic spline coefficients
newx: ndarrayNew set of points.
dx: float, optionalOld sample-spacing, the default value is 1.0.
x0: int, optionalOld origin, the default value is 0.
Returns
res: ndarrayEvaluated a quadratic spline points.
Notes
dx is the old sample-spacing while x0 was the old origin. In other-words the old-sample points (knot-points) for which the cj represent spline coefficients were at equally-spaced points of
oldx = x0 + j*dx j=0...N-1, with N=len(cj)Edges are handled using mirror-symmetric boundary conditions.
Examples
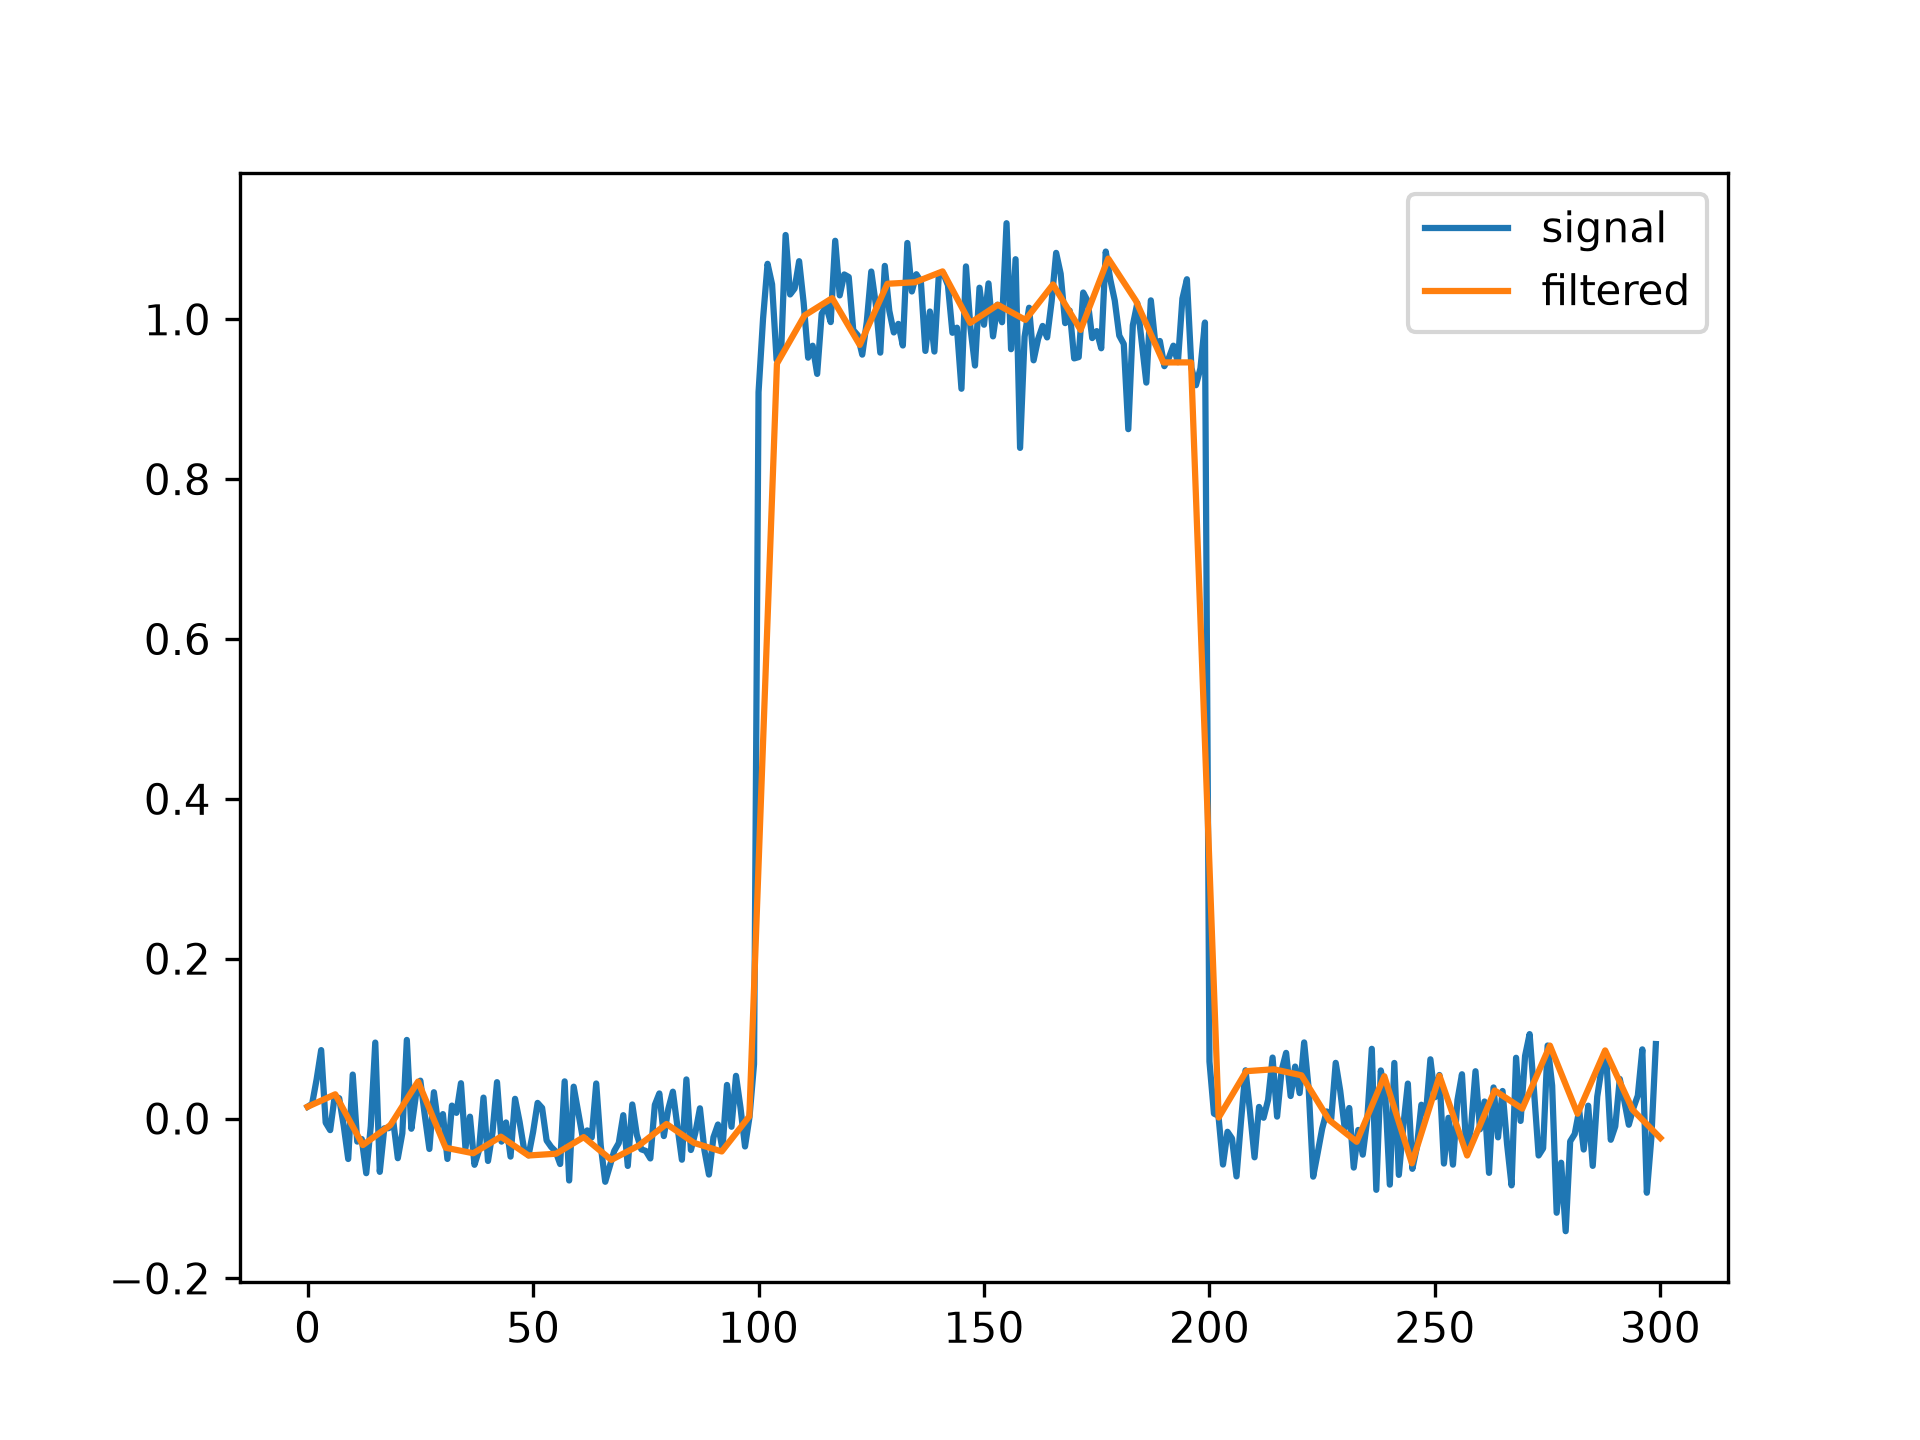
We can filter a signal to reduce and smooth out high-frequency noise with a quadratic spline:import numpy as np import matplotlib.pyplot as plt from scipy.signal import qspline1d, qspline1d_eval rng = np.random.default_rng() sig = np.repeat([0., 1., 0.], 100) sig += rng.standard_normal(len(sig))*0.05 # add noise time = np.linspace(0, len(sig)) filtered = qspline1d_eval(qspline1d(sig), time)✓
plt.plot(sig, label="signal")
plt.plot(time, filtered, label="filtered")
plt.legend()
✗
<matplotlib.legend.Legend object at 0x7f3f68537a10>
plt.show()
✓
See also
- qspline1d
Compute quadratic spline coefficients for rank-1 array.
Aliases
scipy.signal.qspline1d_eval