bundles / scipy 2.0.0.dev0+git20260907.41eeb59 / scipy / special / _basic / mathieu_odd_coef
function
scipy.special._basic:mathieu_odd_coef
source: build-install/usr/lib/python3.14/site-packages/scipy/special/_basic.py:1798
Signature
def mathieu_odd_coef(m, q)Summary
Fourier coefficients for odd Mathieu and modified Mathieu functions.
Extended Summary
The Fourier series of the odd solutions of the Mathieu differential equation are of the form
This function returns the coefficients for even input m=2n+2, and the coefficients for odd input m=2n+1.
Parameters
m: intOrder of Mathieu functions. Must be non-negative.
q: float (>=0)Parameter of Mathieu functions. Must be non-negative.
Returns
Bk: ndarrayEven or odd Fourier coefficients, corresponding to even or odd m. The number of coefficients returned is determined by an empirical formula that depends on
mandq[1].
Examples
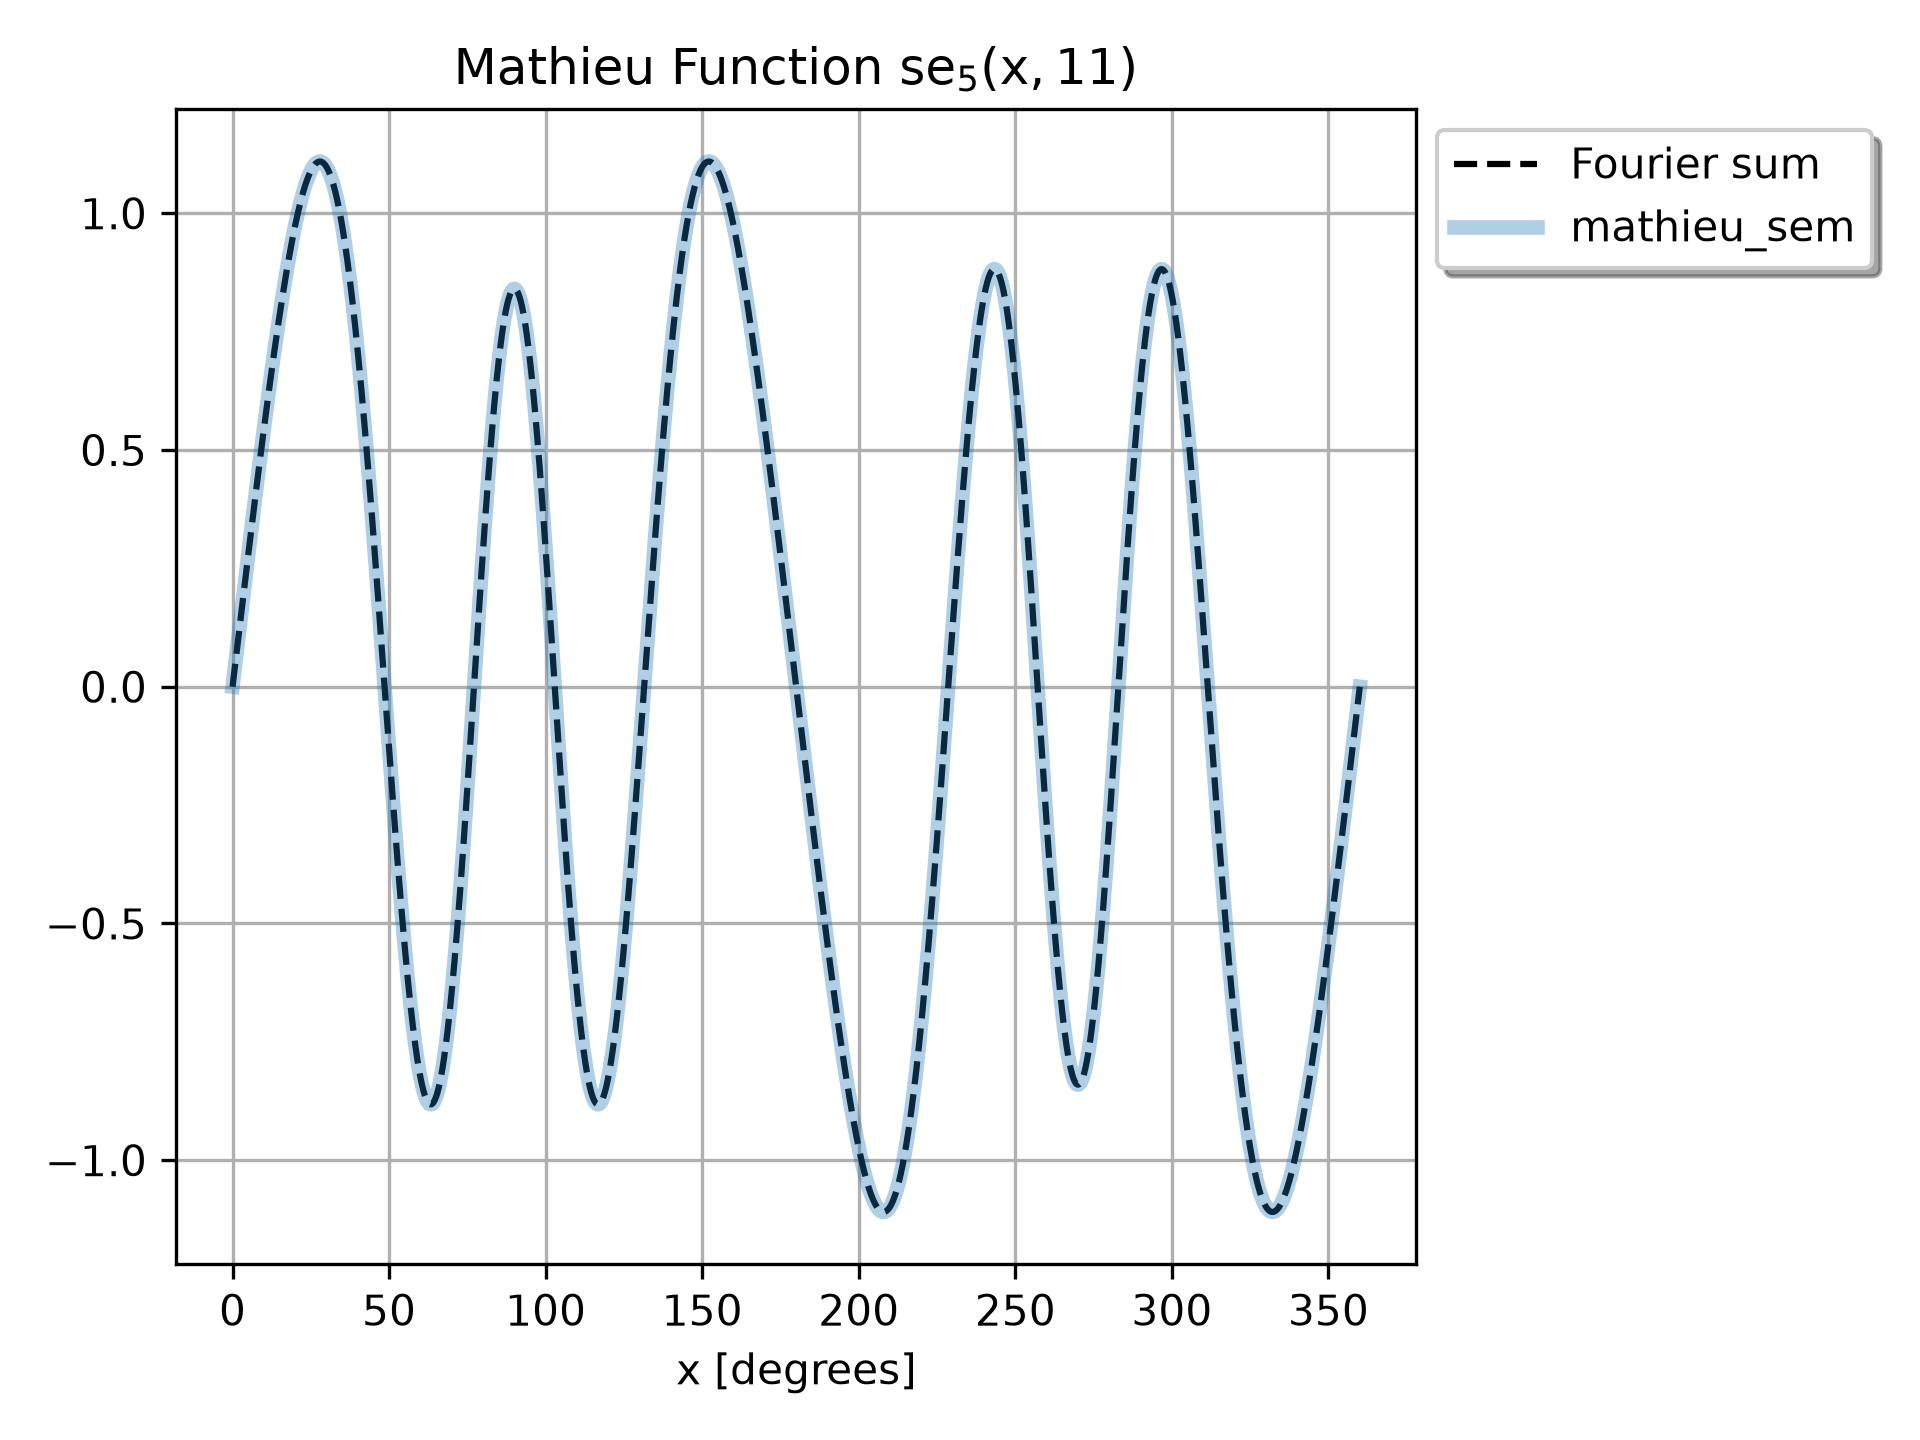
We use the Fourier coefficients to construct an approximation of ``mathieu_sem(5, 11, x)``, the odd Mathieu function of order `m = 5` and parameter `q = 11`.import numpy as np import matplotlib.pyplot as plt from scipy.special import mathieu_odd_coef, mathieu_sem m = 5 q = 11✓
b = mathieu_odd_coef(m, q)
b.shape
✓
(28,)Sum the Fourier sine series on a grid of ``x`` values.
period = 180 if m % 2 == 0 else 360
x = np.linspace(0, period, 5000)               # x has shape (5000,)
k = np.arange(1, len(b) + 1).reshape((-1, 1))  # k has shape (len(b), 1)
c = np.sin((2*k - m % 2) * (np.pi/180) * x)    # c has shape (len(b), 5000)
y = b @ c                                      # y has shape (5000,)
✓
plt.plot(x, y, 'k--', label="Fourier sum")
✗[<matplotlib.lines.Line2D object at 0x7f3f5917e900>]
se, _sce = mathieu_sem(m, q, x)
✓plt.plot(x, se, alpha=0.35, linewidth=3.5, label="mathieu_sem")
✗[<matplotlib.lines.Line2D object at 0x7f3f5917e660>]
plt.grid(True)
✓plt.title(f'Mathieu Function $\\rm{{se_{m}}}(x, {q})$') plt.xlabel('x [degrees]') plt.legend(shadow=True, loc='upper left', bbox_to_anchor=(1, 1))✗
<matplotlib.legend.Legend object at 0x7f3f5917ef90>
plt.tight_layout()
plt.show()
✓
See also
Aliases
scipy.special.mathieu_odd_coef