bundles / scipy 2.0.0.dev0+git20260907.41eeb59 / scipy / special / _orthogonal / jacobi
function
scipy.special._orthogonal:jacobi
source: build-install/usr/lib/python3.14/site-packages/scipy/special/_orthogonal.py:345
Signature
def jacobi(n, alpha, beta, monic = False)Summary
Jacobi polynomial.
Extended Summary
Defined to be the solution of
for ; is a polynomial of degree .
Parameters
n: intDegree of the polynomial.
alpha: floatParameter, must be greater than -1.
beta: floatParameter, must be greater than -1.
monic: bool, optionalIf True, scale the leading coefficient to be 1. Default is False.
Returns
P: orthopoly1dJacobi polynomial.
Notes
For fixed , the polynomials are orthogonal over with weight function .
Examples
The Jacobi polynomials satisfy the recurrence relation: .. math:: P_n^{(\alpha, \beta-1)}(x) - P_n^{(\alpha-1, \beta)}(x) = P_{n-1}^{(\alpha, \beta)}(x) This can be verified, for example, for :math:`\alpha = \beta = 2` and :math:`n = 1` over the interval :math:`[-1, 1]`:import numpy as np from scipy.special import jacobi x = np.arange(-1.0, 1.0, 0.01) np.allclose(jacobi(0, 2, 2)(x), jacobi(1, 2, 1)(x) - jacobi(1, 1, 2)(x))✓
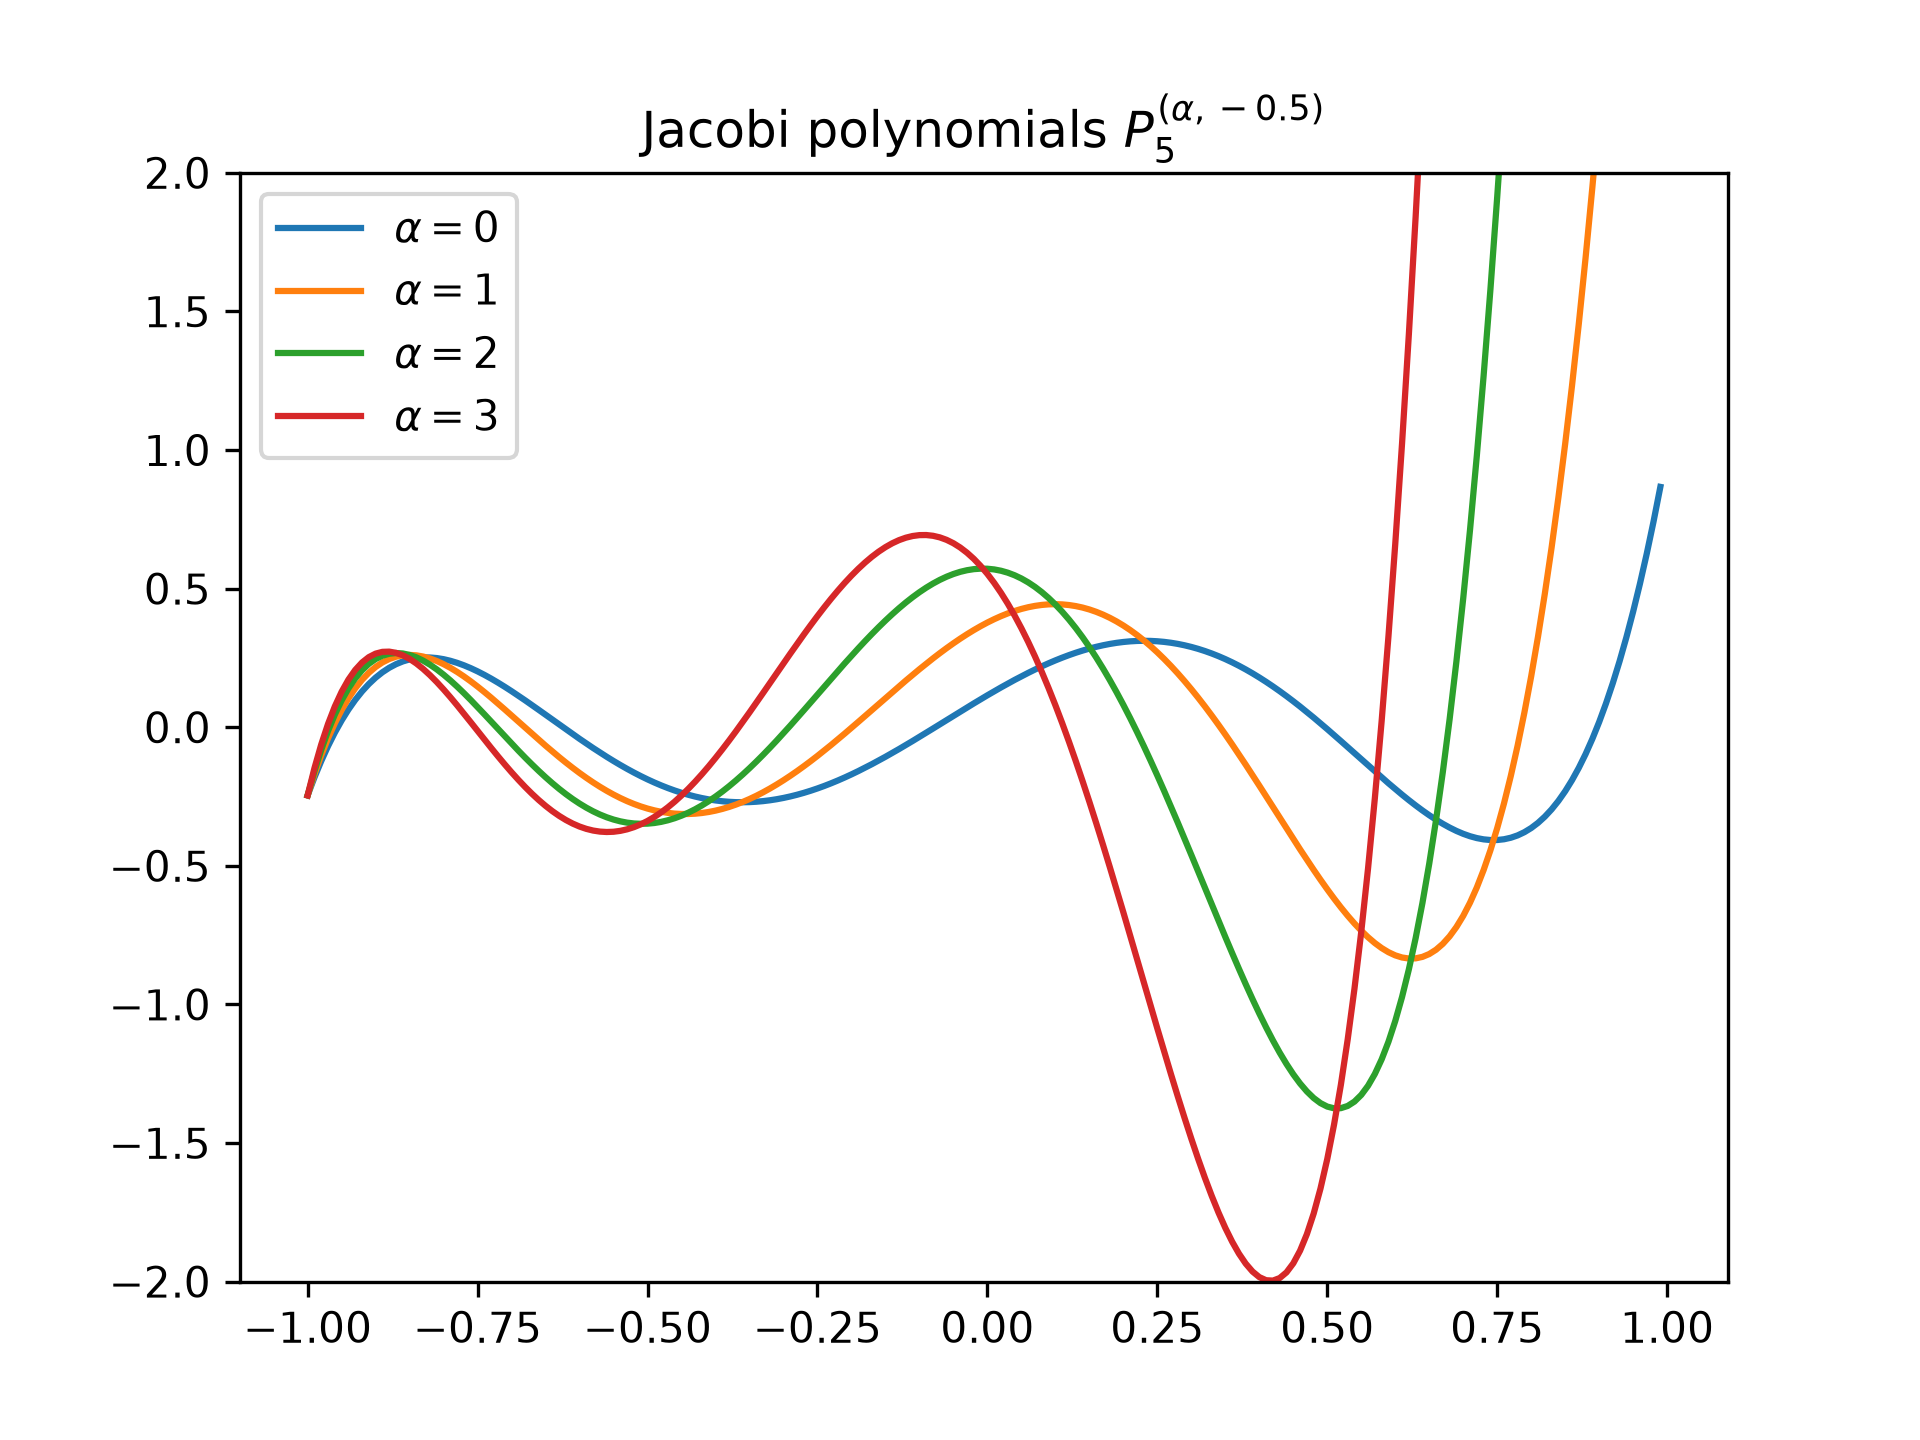
TruePlot of the Jacobi polynomial :math:`P_5^{(\alpha, -0.5)}` for different values of :math:`\alpha`:
import matplotlib.pyplot as plt
x = np.arange(-1.0, 1.0, 0.01)
fig, ax = plt.subplots()
✓
ax.set_ylim(-2.0, 2.0)
ax.set_title(r'Jacobi polynomials $P_5^{(\alpha, -0.5)}$')
for alpha in np.arange(0, 4, 1):
    ax.plot(x, jacobi(5, alpha, -0.5)(x), label=rf'$\alpha={alpha}$')
plt.legend(loc='best')
✗
<matplotlib.legend.Legend object at 0x7f3f601c3380>
plt.show()
✓
Aliases
scipy.special.jacobi