bundles / scipy 2.0.0.dev0+git20260907.41eeb59 / scipy / stats / _circstats / circvar
function
scipy.stats._circstats:circvar
source: build-install/usr/lib/python3.14/site-packages/scipy/stats/_circstats.py:411
Signature
def circvar(samples, high = 6.283185307179586, low = 0, axis = None, nan_policy = propagate, *, keepdims = False)Summary
Compute the circular variance of a sample of angle observations.
Extended Summary
Given angle observations measured in radians, their circular variance is defined by ([2], Eq. 2.3.3)
where is the imaginary unit and gives the length of the complex number . in the above expression is known as the mean resultant length.
Parameters
samples: array_likeInput array of angle observations. The value of a full angle is equal to
(high - low).high: float, optionalUpper boundary of the principal value of an angle. Default is
2*pi.low: float, optionalLower boundary of the principal value of an angle. Default is
0.axis: int or None, default: NoneIf an int, the axis of the input along which to compute the statistic. The statistic of each axis-slice (e.g. row) of the input will appear in a corresponding element of the output. If
None, the input will be raveled before computing the statistic.nan_policy: {'propagate', 'omit', 'raise'}Defines how to handle input NaNs.
propagate: if a NaN is present in the axis slice (e.g. row) along which the statistic is computed, the corresponding entry of the output will be NaN.omit: NaNs will be omitted when performing the calculation. If insufficient data remains in the axis slice along which the statistic is computed, the corresponding entry of the output will be NaN.raise: if a NaN is present, aValueErrorwill be raised.
nan_policy='raise'andnan_policy='omit'are not supported by lazy backends, andnan_policy='omit'is not compatible with MArray input. For multidimensional input,nan_policy='omit'is supported only by the NumPy backend. Instead, mask NaN values using MArray; and use the defaultnan_policy. See Notes for support information.keepdims: bool, default: FalseIf this is set to True, the axes which are reduced are left in the result as dimensions with size one. With this option, the result will broadcast correctly against the input array.
Returns
circvar: floatCircular variance. The returned value is in the range
[0, 1], where0indicates no variance and1indicates large variance.If the input array is empty,
np.nanis returned.
Notes
In the limit of small angles, the circular variance is close to half the 'linear' variance if measured in radians.
Beginning in SciPy 1.9, np.matrix inputs (not recommended for new code) are converted to np.ndarray before the calculation is performed. In this case, the output will be a scalar or np.ndarray of appropriate shape rather than a 2D np.matrix. Similarly, while masked elements of masked arrays are ignored, the output will be a scalar or np.ndarray rather than a masked array with mask=False.
Examples
import numpy as np
from scipy.stats import circvar
import matplotlib.pyplot as plt
samples_1 = np.array([0.072, -0.158, 0.077, 0.108, 0.286,
                      0.133, -0.473, -0.001, -0.348, 0.131])
samples_2 = np.array([0.111, -0.879, 0.078, 0.733, 0.421,
                      0.104, -0.136, -0.867,  0.012,  0.105])
circvar_1 = circvar(samples_1)
circvar_2 = circvar(samples_2)
✓
fig, (left, right) = plt.subplots(ncols=2)
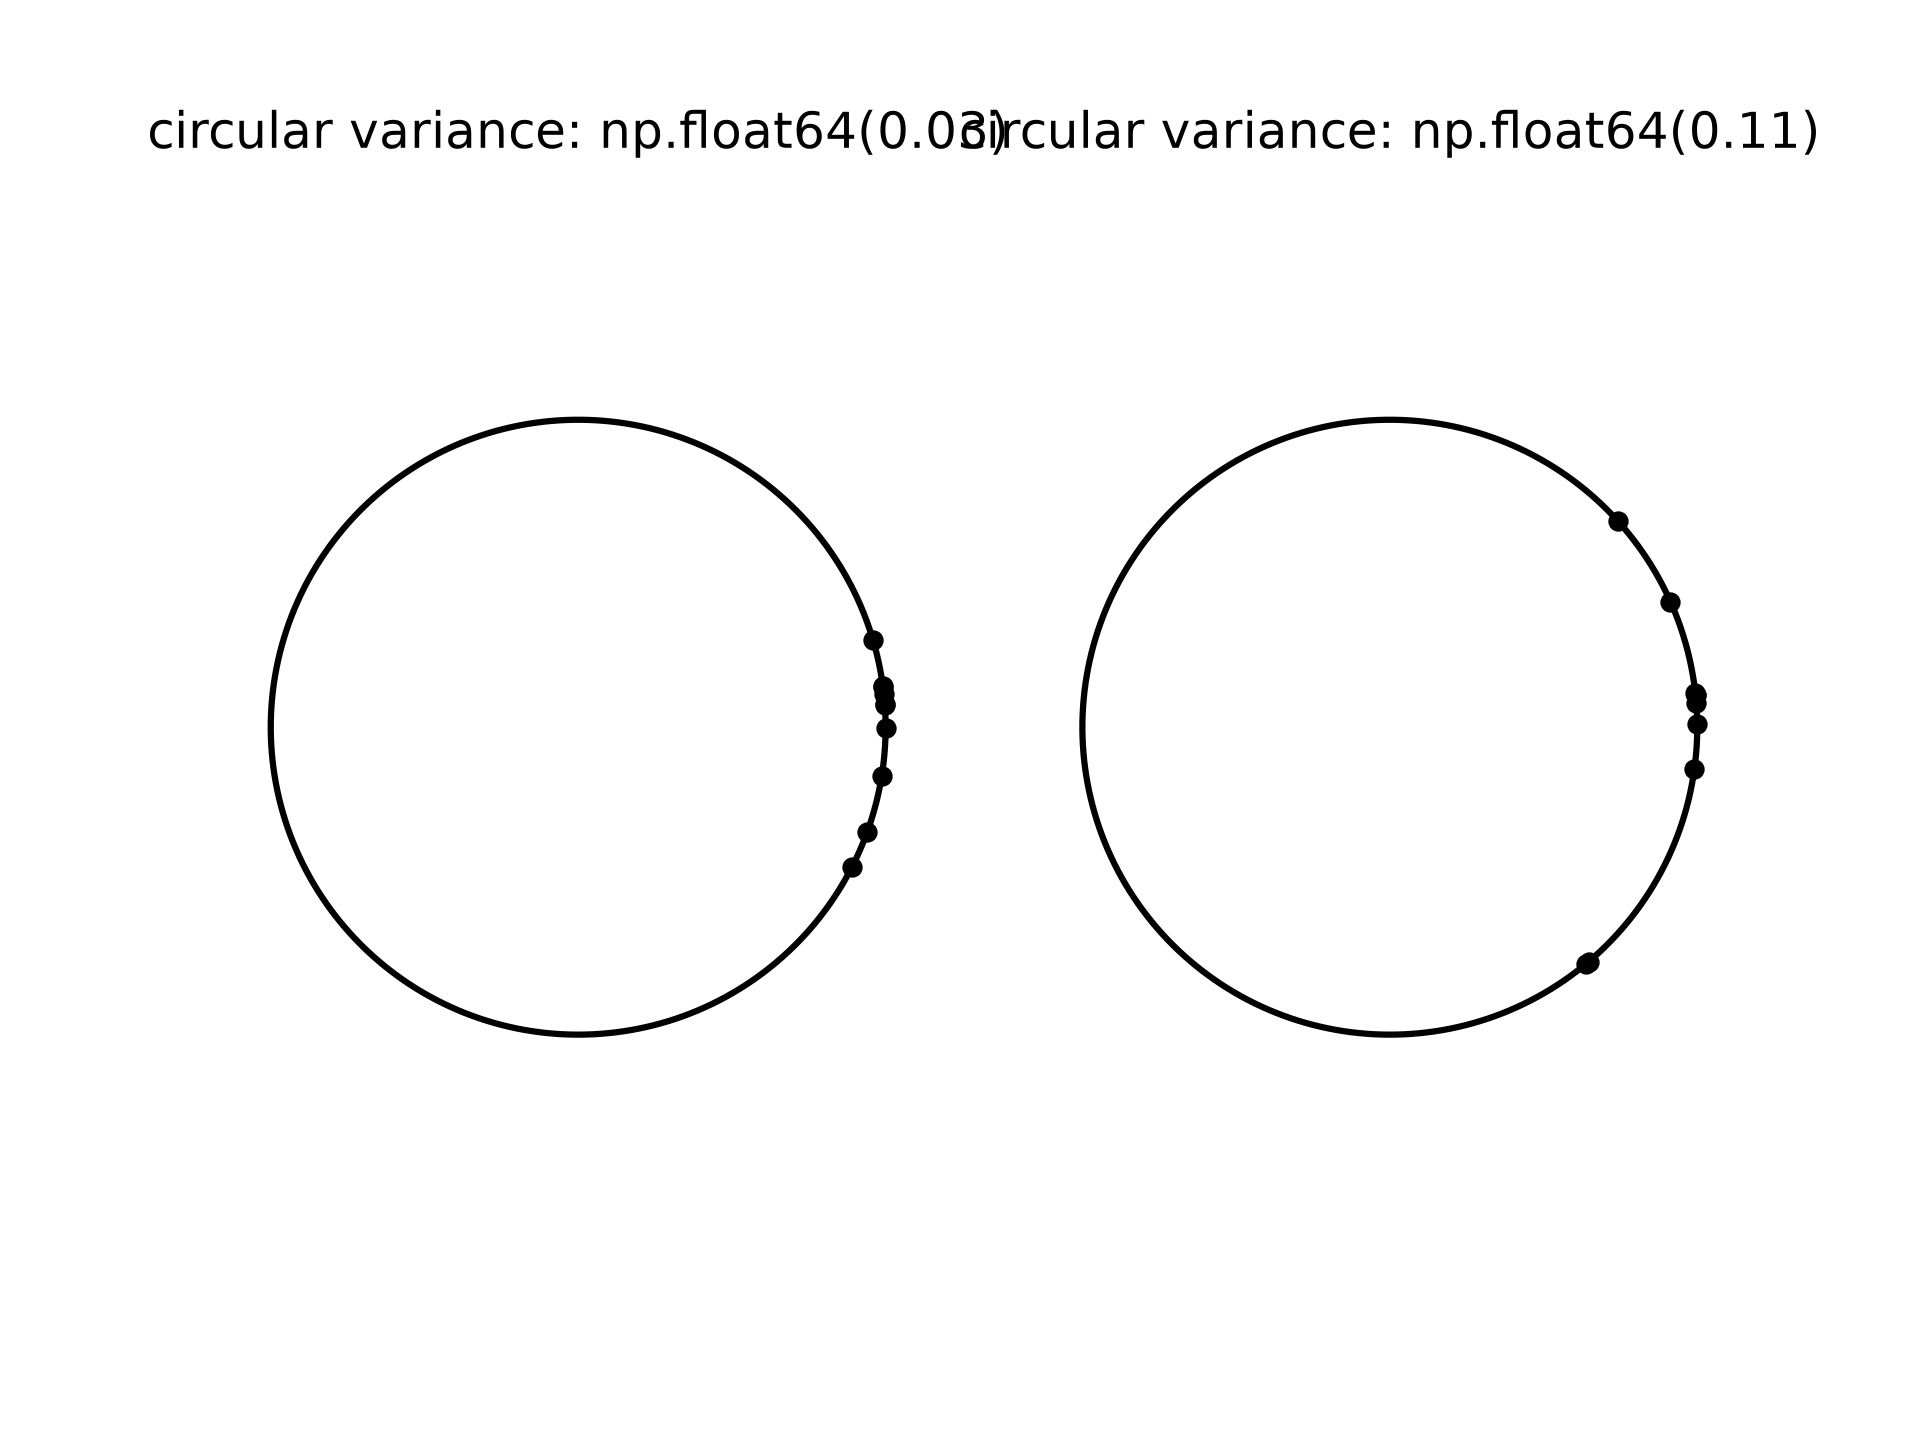
✓for image in (left, right): image.plot(np.cos(np.linspace(0, 2*np.pi, 500)), np.sin(np.linspace(0, 2*np.pi, 500)), c='k') image.axis('equal') image.axis('off') left.scatter(np.cos(samples_1), np.sin(samples_1), c='k', s=15) left.set_title(f"circular variance: {np.round(circvar_1, 2)!r}") right.scatter(np.cos(samples_2), np.sin(samples_2), c='k', s=15) right.set_title(f"circular variance: {np.round(circvar_2, 2)!r}")✗
Text(0.5, 1.0, 'circular variance: np.float64(0.11)')
plt.show()
✓
See also
Aliases
scipy.stats.circvar