bundles / scipy 2.0.0.dev0+git20260907.41eeb59 / scipy / stats / _mstats_basic / _theilslopes
function
scipy.stats._mstats_basic:_theilslopes
source: build-install/usr/lib/python3.14/site-packages/scipy/stats/_mstats_basic.py:1180
Signature
def _theilslopes(y, x = None, alpha = 0.95, method = separate)Summary
Computes the Theil-Sen estimator for a set of points (x, y).
Extended Summary
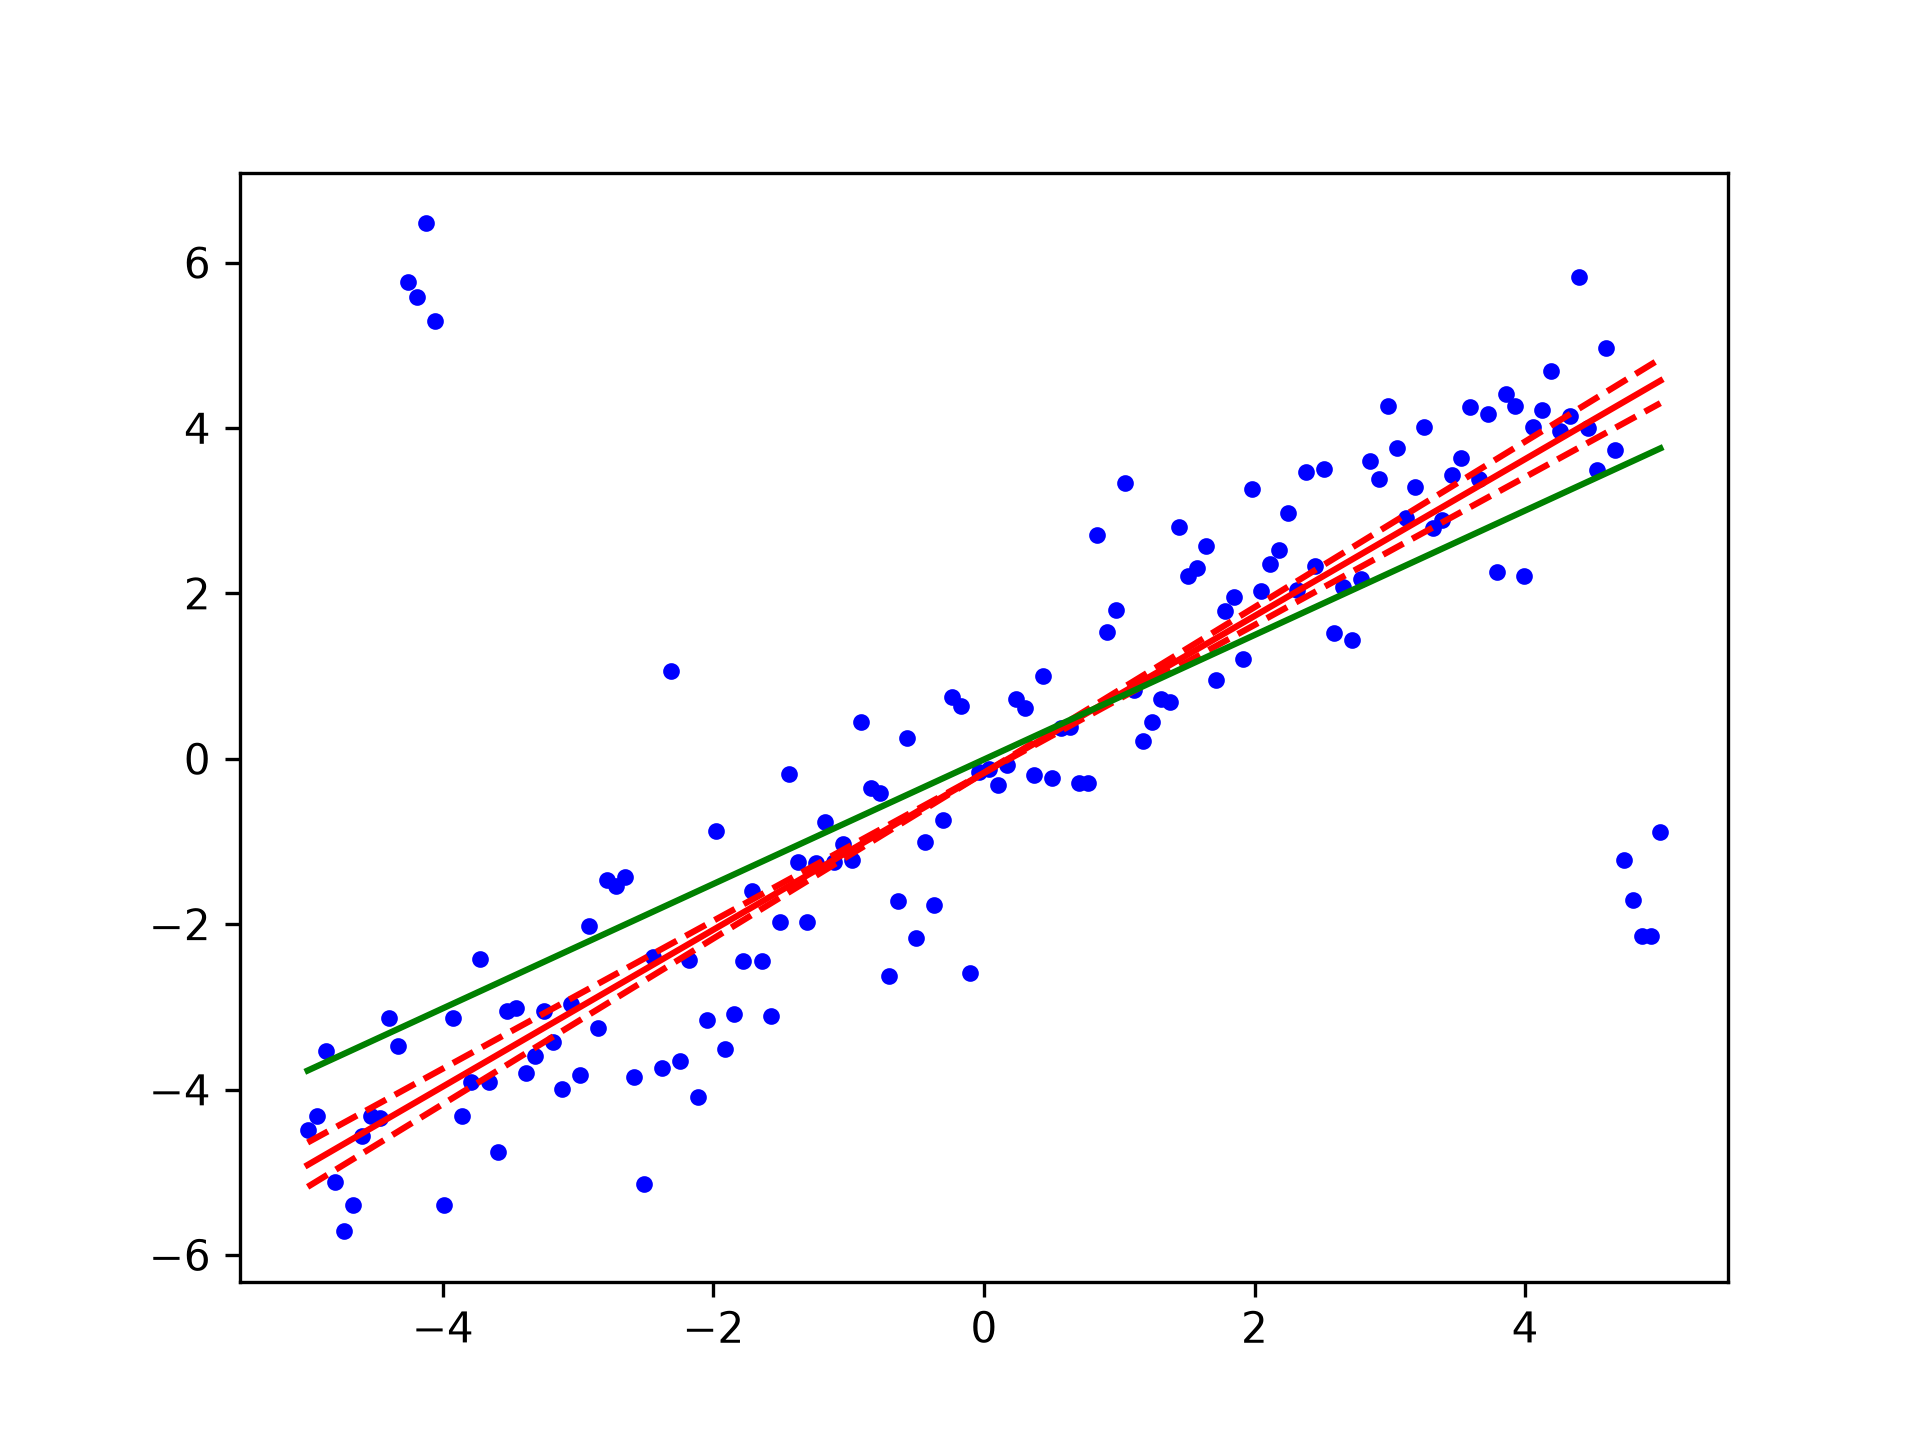
theilslopes implements a method for robust linear regression. It computes the slope as the median of all slopes between paired values.
Parameters
y: array_likeDependent variable.
x: array_like or None, optionalIndependent variable. If None, use
arange(len(y))instead.alpha: float, optionalConfidence degree between 0 and 1. Default is 95% confidence. Note that
alphais symmetric around 0.5, i.e. both 0.1 and 0.9 are interpreted as "find the 90% confidence interval".method: {'joint', 'separate'}, optionalMethod to be used for computing estimate for intercept. Following methods are supported,
'joint': Uses np.median(y - slope * x) as intercept.
'separate': Uses np.median(y) - slope * np.median(x)
as intercept.
The default is 'separate'.
Returns
result: ``TheilslopesResult`` instanceThe return value is an object with the following attributes:
slope
Theil slope.
intercept
Intercept of the Theil line.
low_slope
Lower bound of the confidence interval on
slope.high_slope
Upper bound of the confidence interval on
slope.
Notes
The implementation of theilslopes follows [1]. The intercept is not defined in [1], and here it is defined as median(y) - slope*median(x), which is given in [3]. Other definitions of the intercept exist in the literature such as median(y - slope*x) in [4]. The approach to compute the intercept can be determined by the parameter method. A confidence interval for the intercept is not given as this question is not addressed in [1].
For compatibility with older versions of SciPy, the return value acts like a namedtuple of length 4, with fields slope, intercept, low_slope, and high_slope, so one can continue to write
slope, intercept, low_slope, high_slope = theilslopes(y, x)Examples
import numpy as np
from scipy import stats
import matplotlib.pyplot as plt
✓
x = np.linspace(-5, 5, num=150)
y = x + np.random.normal(size=x.size)
y[11:15] += 10  # add outliers
y[-5:] -= 7
✓
res = stats.theilslopes(y, x, 0.90, method='separate')
lsq_res = stats.linregress(x, y)
✓
fig = plt.figure()
ax = fig.add_subplot(111)
✓
ax.plot(x, y, 'b.')
ax.plot(x, res[1] + res[0] * x, 'r-')
ax.plot(x, res[1] + res[2] * x, 'r--')
ax.plot(x, res[1] + res[3] * x, 'r--')
ax.plot(x, lsq_res[1] + lsq_res[0] * x, 'g-')
✗
[<matplotlib.lines.Line2D object at 0x7f3f60b816a0>]
plt.show()
✓
See also
- siegelslopes
a similar technique using repeated medians
Aliases
scipy.stats._mstats_basic._theilslopes