bundles / scipy 2.0.0.dev0+git20260907.41eeb59 / scipy / stats / _multivariate / multivariate_normal_gen
class
scipy.stats._multivariate:multivariate_normal_gen
source: build-install/usr/lib/python3.14/site-packages/scipy/stats/_multivariate.py:345
Signature
class multivariate_normal_gen(seed = None)Members
Summary
A multivariate normal random variable.
Extended Summary
The mean keyword specifies the mean. The cov keyword specifies the covariance matrix.
Parameters
%(_mvn_doc_default_callparams)s%(_doc_random_state)s
Methods
pdf(x, mean=None, cov=1, allow_singular=False)Probability density function.
logpdf(x, mean=None, cov=1, allow_singular=False)Log of the probability density function.
cdf(x, mean=None, cov=1, allow_singular=False, maxpts=1000000*dim, abseps=1e-5, releps=1e-5, lower_limit=None)Cumulative distribution function.
logcdf(x, mean=None, cov=1, allow_singular=False, maxpts=1000000*dim, abseps=1e-5, releps=1e-5)Log of the cumulative distribution function.
rvs(mean=None, cov=1, size=1, random_state=None)Draw random samples from a multivariate normal distribution.
entropy(mean=None, cov=1)Compute the differential entropy of the multivariate normal.
marginal(dimensions, mean=None, cov=1, allow_singular=False)Return a marginal multivariate normal distribution.
fit(x, fix_mean=None, fix_cov=None)Fit a multivariate normal distribution to data.
Notes
%(_mvn_doc_callparams_note)s
The covariance matrix cov may be an instance of a subclass of Covariance, e.g. scipy.stats.CovViaPrecision. If so, allow_singular is ignored.
Otherwise, cov must be a symmetric positive semidefinite matrix when allow_singular is True; it must be (strictly) positive definite when allow_singular is False. Symmetry is not checked; only the lower triangular portion is used. The determinant and inverse of cov are computed as the pseudo-determinant and pseudo-inverse, respectively, so that cov does not need to have full rank.
The probability density function for multivariate_normal is
where is the mean, the covariance matrix, the rank of . In case of singular , SciPy extends this definition according to [1].
Examples
import numpy as np
import matplotlib.pyplot as plt
from scipy.stats import multivariate_normal
✓
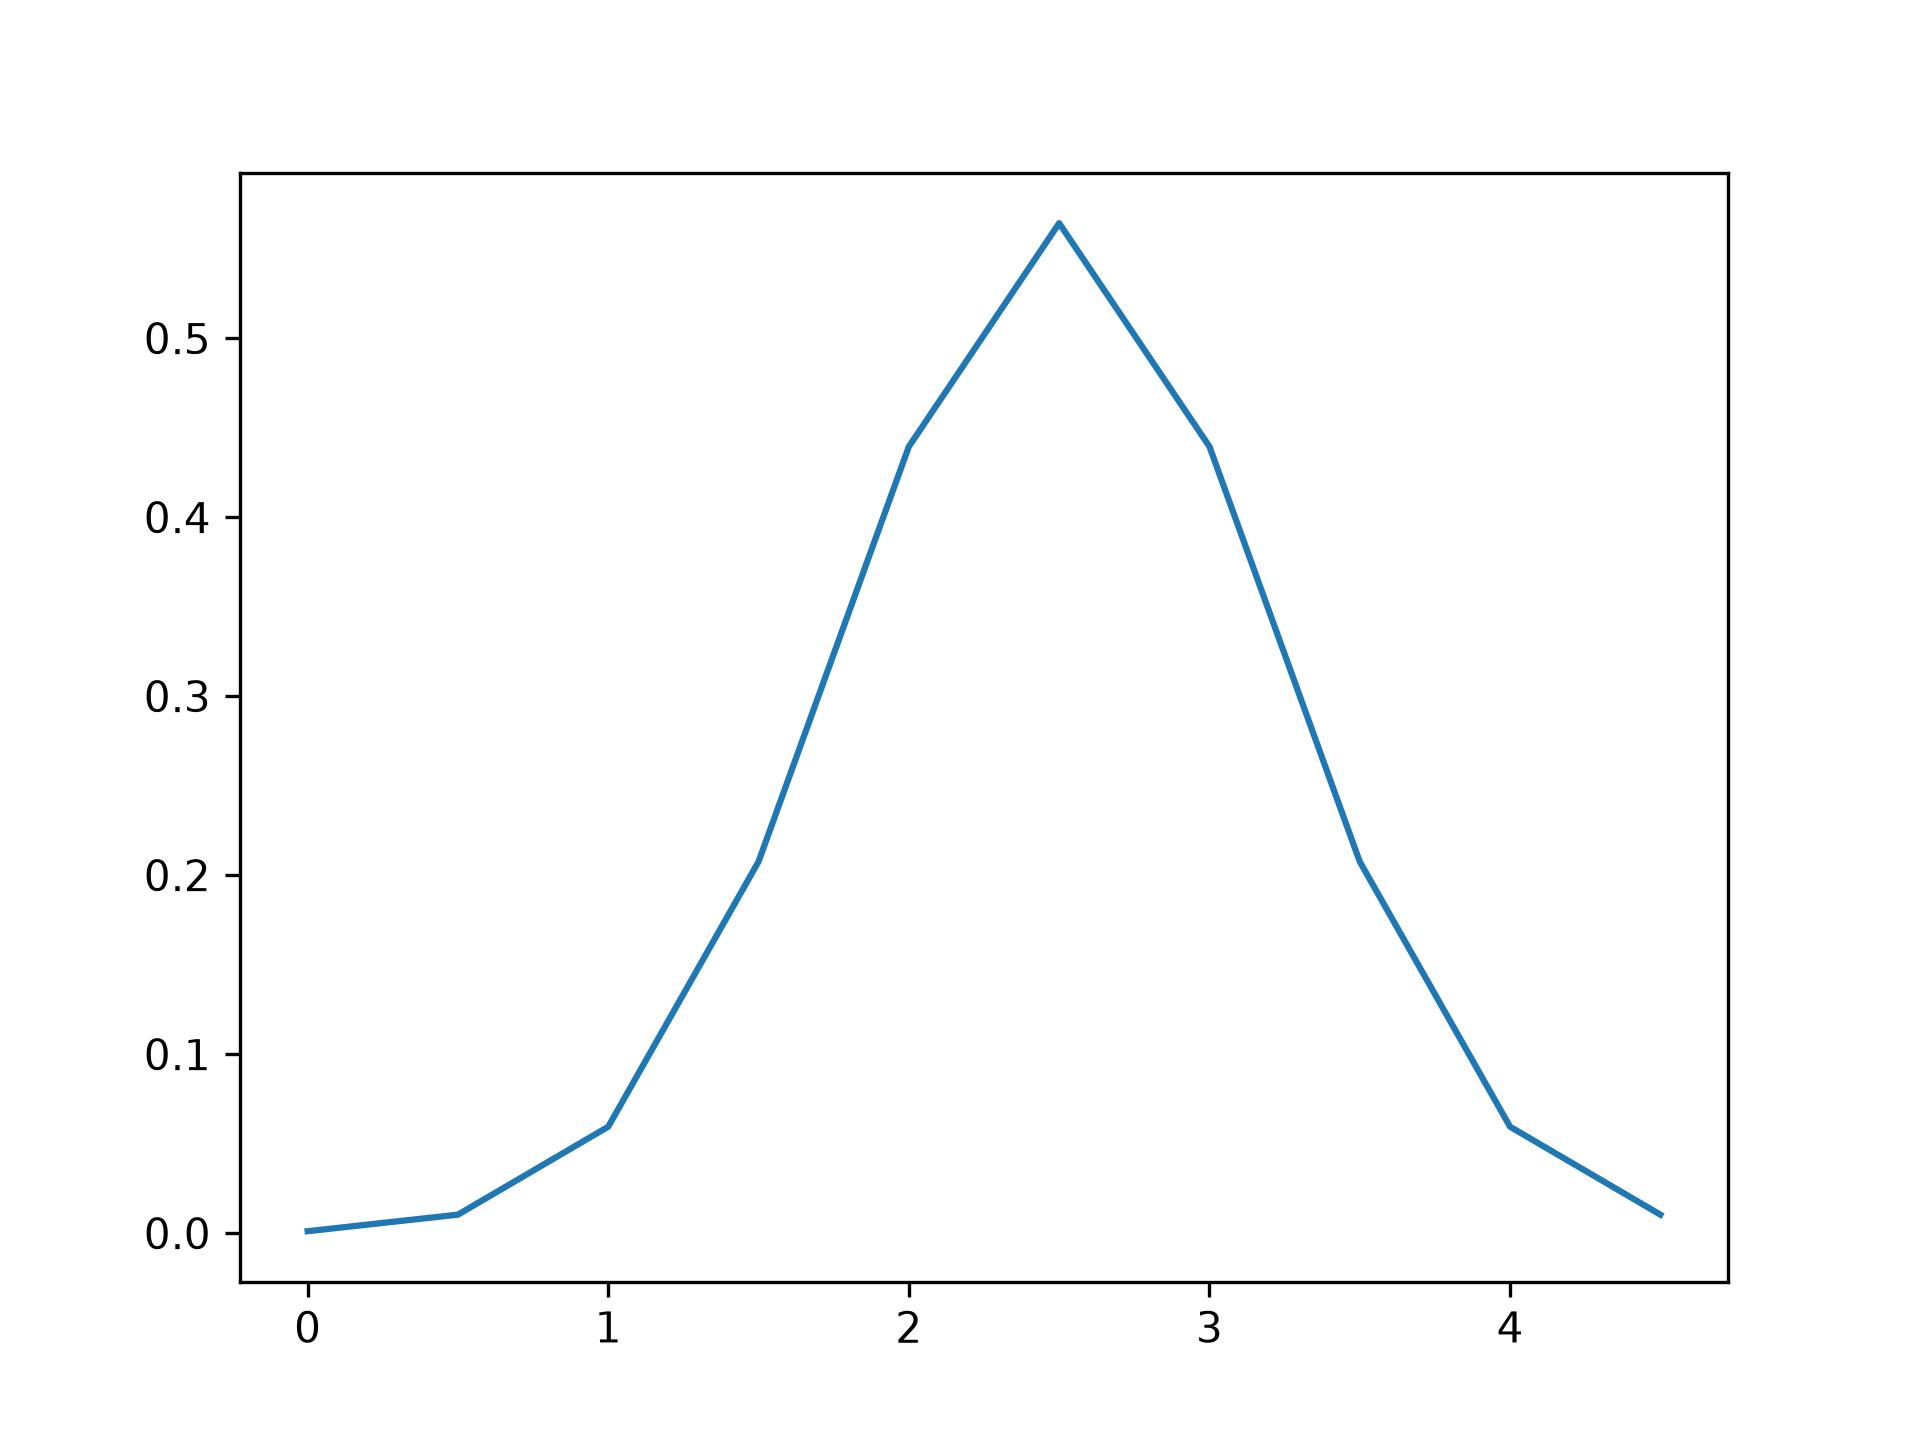
x = np.linspace(0, 5, 10, endpoint=False)
✓y = multivariate_normal.pdf(x, mean=2.5, cov=0.5); y
✗array([0.00109, 0.01033, 0.05947, 0.20755, 0.43939, 0.56419, 0.43939,
0.20755, 0.05947, 0.01033])
fig1 = plt.figure()
ax = fig1.add_subplot(111)
✓
ax.plot(x, y)
✗[<matplotlib.lines.Line2D object at 0x7f3f58a99940>]
plt.show()
✓
rv = multivariate_normal(mean=None, cov=1, allow_singular=False)
✓x, y = np.mgrid[-1:1:.01, -1:1:.01] pos = np.dstack((x, y)) rv = multivariate_normal([0.5, -0.2], [[2.0, 0.3], [0.3, 0.5]]) fig2 = plt.figure() ax2 = fig2.add_subplot(111)✓
ax2.contourf(x, y, rv.pdf(pos))
✗<matplotlib.contour.QuadContourSet object at 0x7f3f60eca660>
Aliases
scipy.stats._multivariate.multivariate_normal_gen