bundles / scipy 2.0.0.dev0+git20260907.41eeb59 / scipy / stats / _qmc / geometric_discrepancy
function
scipy.stats._qmc:geometric_discrepancy
source: build-install/usr/lib/python3.14/site-packages/scipy/stats/_qmc.py:335
Signature
def geometric_discrepancy(sample: npt.ArrayLike, method: Literal['mindist', 'mst'] = mindist, metric: str = euclidean) → floatSummary
Discrepancy of a given sample based on its geometric properties.
Parameters
sample: array_like (n, d)The sample to compute the discrepancy from.
method: {"mindist", "mst"}, optionalThe method to use. One of
mindistfor minimum distance (default) ormstfor minimum spanning tree.metric: str or callable, optionalThe distance metric to use. See the documentation for scipy.spatial.distance.pdist for the available metrics and the default.
Returns
discrepancy: floatDiscrepancy (higher values correspond to greater sample uniformity).
Notes
The discrepancy can serve as a simple measure of quality of a random sample. This measure is based on the geometric properties of the distribution of points in the sample, such as the minimum distance between any pair of points, or the mean edge length in a minimum spanning tree.
The higher the value is, the better the coverage of the parameter space is. Note that this is different from scipy.stats.qmc.discrepancy, where lower values correspond to higher quality of the sample.
Also note that when comparing different sampling strategies using this function, the sample size must be kept constant.
It is possible to calculate two metrics from the minimum spanning tree: the mean edge length and the standard deviation of edges lengths. Using both metrics offers a better picture of uniformity than either metric alone, with higher mean and lower standard deviation being preferable (see [1] for a brief discussion). This function currently only calculates the mean edge length.
Examples
Calculate the quality of the sample using the minimum euclidean distance (the defaults):import numpy as np from scipy.stats import qmc rng = np.random.default_rng(191468432622931918890291693003068437394) sample = qmc.LatinHypercube(d=2, rng=rng).random(50)✓
qmc.geometric_discrepancy(sample)
✗np.float64(0.03708161435687876)Calculate the quality using the mean edge length in the minimum spanning tree:
qmc.geometric_discrepancy(sample, method='mst')
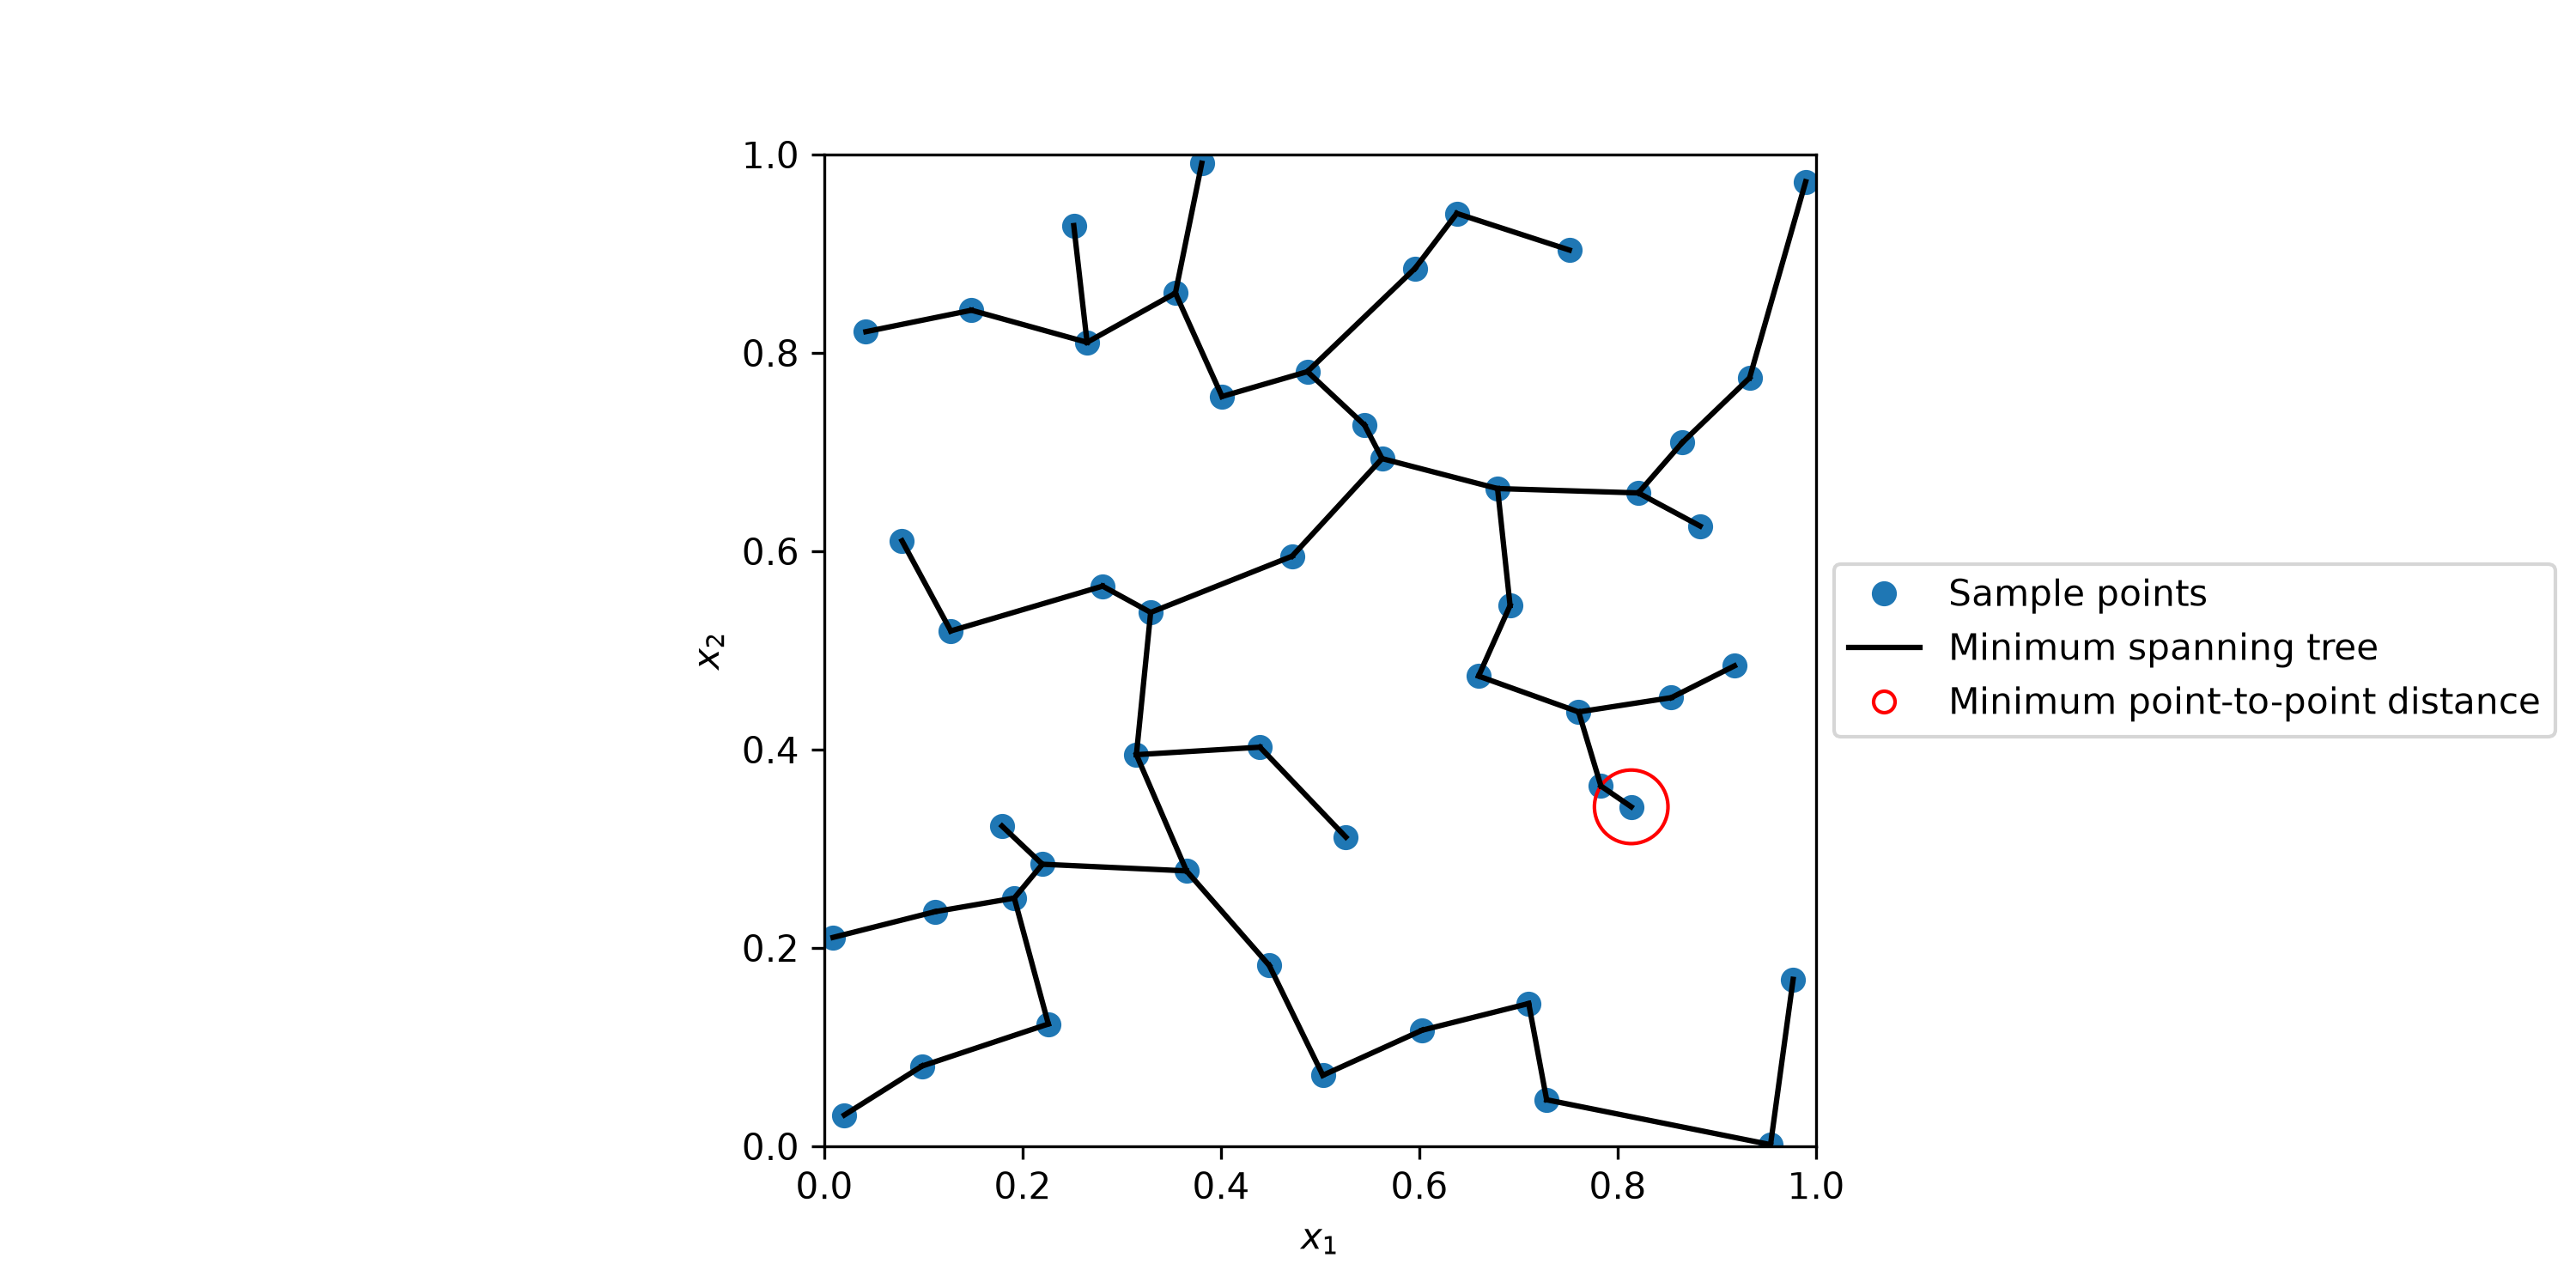
✗np.float64(0.1105149978798376)Display the minimum spanning tree and the points with the smallest distance:
import matplotlib.pyplot as plt
from matplotlib.lines import Line2D
from scipy.sparse.csgraph import minimum_spanning_tree
from scipy.spatial.distance import pdist, squareform
dist = pdist(sample)
mst = minimum_spanning_tree(squareform(dist))
edges = np.where(mst.toarray() > 0)
edges = np.asarray(edges).T
min_dist = np.min(dist)
min_idx = np.argwhere(squareform(dist) == min_dist)[0]
fig, ax = plt.subplots(figsize=(10, 5))
_ = ax.set(aspect='equal', xlabel=r'$x_1$', ylabel=r'$x_2$',
           xlim=[0, 1], ylim=[0, 1])
✓
for edge in edges:
    ax.plot(sample[edge, 0], sample[edge, 1], c='k')
ax.scatter(sample[:, 0], sample[:, 1])
ax.add_patch(plt.Circle(sample[min_idx[0]], min_dist, color='red', fill=False))
✗
<matplotlib.patches.Circle object at 0x7f3f691182d0>
markers = [
    Line2D([0], [0], marker='o', lw=0, label='Sample points'),
    Line2D([0], [0], color='k', label='Minimum spanning tree'),
    Line2D([0], [0], marker='o', lw=0, markerfacecolor='w', markeredgecolor='r',
           label='Minimum point-to-point distance'),
]
✓
ax.legend(handles=markers, loc='center left', bbox_to_anchor=(1, 0.5));
✗<matplotlib.legend.Legend object at 0x7f3f590a1fd0>
plt.show()
✓
See also
Aliases
scipy.stats._qmc.geometric_discrepancy