bundles / scipy 2.0.0.dev0+git20260907.41eeb59 / scipy / stats / _resampling / bootstrap
function
scipy.stats._resampling:bootstrap
source: build-install/usr/lib/python3.14/site-packages/scipy/stats/_resampling.py:298
Signature
def bootstrap(data, statistic, *, n_resamples = 9999, batch = None, vectorized = None, paired = False, axis = 0, confidence_level = 0.95, alternative = two-sided, method = BCa, bootstrap_result = None, rng = None, random_state = None)Summary
Compute a two-sided bootstrap confidence interval of a statistic.
Extended Summary
When method is 'percentile' and alternative is 'two-sided', a bootstrap confidence interval is computed according to the following procedure.
Resample the data: for each sample in
dataand for each ofn_resamples, take a random sample of the original sample (with replacement) of the same size as the original sample.Compute the bootstrap distribution of the statistic: for each set of resamples, compute the test statistic.
Determine the confidence interval: find the interval of the bootstrap distribution that is
symmetric about the median and
contains
confidence_levelof the resampled statistic values.
While the 'percentile' method is the most intuitive, it is rarely used in practice. Two more common methods are available, 'basic' ('reverse percentile') and 'BCa' ('bias-corrected and accelerated'); they differ in how step 3 is performed.
If the samples in data are taken at random from their respective distributions times, the confidence interval returned by bootstrap will contain the true value of the statistic for those distributions approximately `confidence_level` times.
Parameters
data: sequence of array-likeEach element of
datais a sample containing scalar observations from an underlying distribution. Elements ofdatamust be broadcastable to the same shape (with the possible exception of the dimension specified byaxis).statistic: callableStatistic for which the confidence interval is to be calculated.
statisticmust be a callable that acceptslen(data)samples as separate arguments and returns the resulting statistic. Ifvectorizedis setTrue,statisticmust also accept a keyword argumentaxisand be vectorized to compute the statistic along the providedaxis.n_resamples: int, default: ``9999``The number of resamples performed to form the bootstrap distribution of the statistic.
batch: int, optionalThe number of resamples to process in each vectorized call to
statistic. Memory usage is O(batch*n), wherenis the sample size. Default isNone, in which casebatch = n_resamples(orbatch = max(n_resamples, n)formethod='BCa').vectorized: bool, optionalIf
vectorizedis setFalse,statisticwill not be passed keyword argumentaxisand is expected to calculate the statistic only for 1D samples. IfTrue,statisticwill be passed keyword argumentaxisand is expected to calculate the statistic alongaxiswhen passed an ND sample array. IfNone(default),vectorizedwill be setTrueifaxisis a parameter ofstatistic. Use of a vectorized statistic typically reduces computation time.paired: bool, default: ``False``Whether the statistic treats corresponding elements of the samples in
dataas paired. If True, bootstrap resamples an array of indices and uses the same indices for all arrays indata; otherwise, bootstrap independently resamples the elements of each array.axis: int, default: ``0``The axis of the samples in
dataalong which thestatisticis calculated.confidence_level: float, default: ``0.95``The confidence level of the confidence interval.
alternative: {'two-sided', 'less', 'greater'}, default: ``'two-sided'``Choose
'two-sided'(default) for a two-sided confidence interval,'less'for a one-sided confidence interval with the lower bound at-np.inf, and'greater'for a one-sided confidence interval with the upper bound atnp.inf. The other bound of the one-sided confidence intervals is the same as that of a two-sided confidence interval withconfidence_leveltwice as far from 1.0; e.g. the upper bound of a 95%'less'confidence interval is the same as the upper bound of a 90%'two-sided'confidence interval.method: {'percentile', 'basic', 'bca'}, default: ``'BCa'``Whether to return the 'percentile' bootstrap confidence interval (
'percentile'), the 'basic' (AKA 'reverse') bootstrap confidence interval ('basic'), or the bias-corrected and accelerated bootstrap confidence interval ('BCa').bootstrap_result: BootstrapResult, optionalProvide the result object returned by a previous call to bootstrap to include the previous bootstrap distribution in the new bootstrap distribution. This can be used, for example, to change
confidence_level, changemethod, or see the effect of performing additional resampling without repeating computations.rng: {None, int, `numpy.random.Generator`}, optionalIf
rngis passed by keyword, types other than numpy.random.Generator are passed to numpy.random.default_rng to instantiate aGenerator. Ifrngis already aGeneratorinstance, then the provided instance is used. Specifyrngfor repeatable function behavior.If this argument is passed by position or
random_stateis passed by keyword, legacy behavior for the argumentrandom_stateapplies:If
random_stateis None (or numpy.random), the numpy.random.RandomState singleton is used.If
random_stateis an int, a newRandomStateinstance is used, seeded withrandom_state.If
random_stateis already aGeneratororRandomStateinstance then that instance is used.
Returns
res: BootstrapResultAn object with attributes:
confidence_interval
The bootstrap confidence interval as an instance of collections.namedtuple with attributes
lowandhigh.bootstrap_distribution
The bootstrap distribution, that is, the value of
statisticfor each resample. The last dimension corresponds with the resamples (e.g.res.bootstrap_distribution.shape[-1] == n_resamples).standard_error
The bootstrap standard error, that is, the sample standard deviation of the bootstrap distribution.
Warns
: `~scipy.stats.DegenerateDataWarning`Generated when
method='BCa'and the bootstrap distribution is degenerate (e.g. all elements are identical).
Notes
Elements of the confidence interval may be NaN for method='BCa' if the bootstrap distribution is degenerate (e.g. all elements are identical). In this case, consider using another method or inspecting data for indications that other analysis may be more appropriate (e.g. all observations are identical).
Examples
Suppose we have sampled data from an unknown distribution.import numpy as np rng = np.random.default_rng() from scipy.stats import norm dist = norm(loc=2, scale=4) # our "unknown" distribution data = dist.rvs(size=100, random_state=rng)✓
std_true = dist.std()      # the true value of the statistic
print(std_true)
std_sample = np.std(data)  # the sample statistic
✓
print(std_sample)
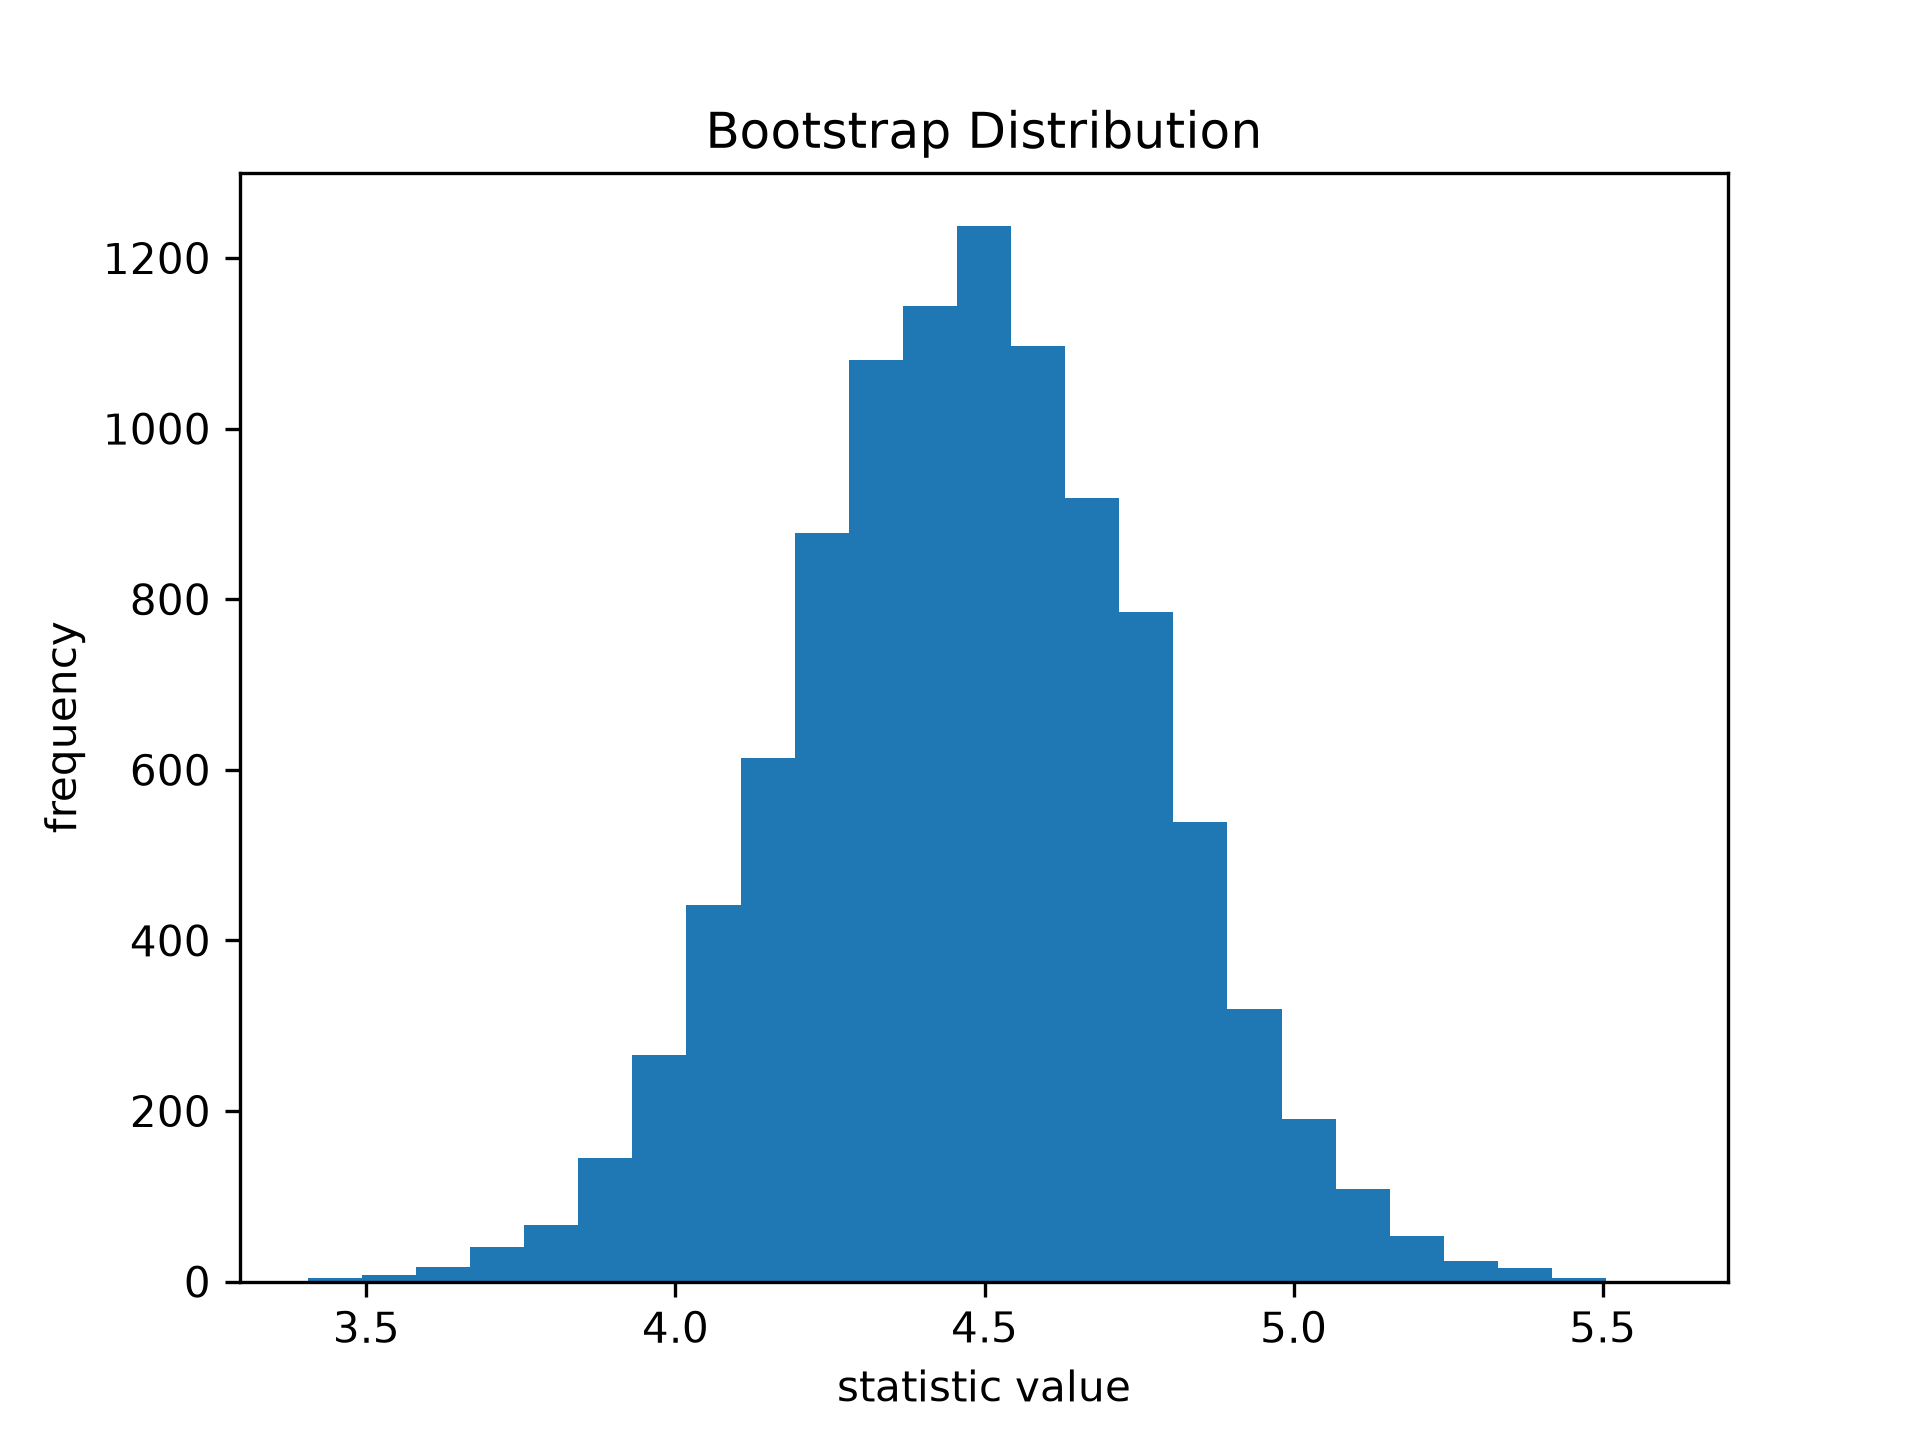
✗4.510906254254069The bootstrap is used to approximate the variability we would expect if we were to repeatedly sample from the unknown distribution and calculate the statistic of the sample each time. It does this by repeatedly resampling values *from the original sample* with replacement and calculating the statistic of each resample. This results in a "bootstrap distribution" of the statistic.
import matplotlib.pyplot as plt
from scipy.stats import bootstrap
data = (data,)  # samples must be in a sequence
res = bootstrap(data, np.std, confidence_level=0.9, rng=rng)
fig, ax = plt.subplots()
✓
ax.hist(res.bootstrap_distribution, bins=25)
ax.set_title('Bootstrap Distribution')
ax.set_xlabel('statistic value')
ax.set_ylabel('frequency')
✗
Text(0, 0.5, 'frequency')
plt.show()
✓
res.standard_error
res.standard_error == np.std(res.bootstrap_distribution, ddof=1)
✗
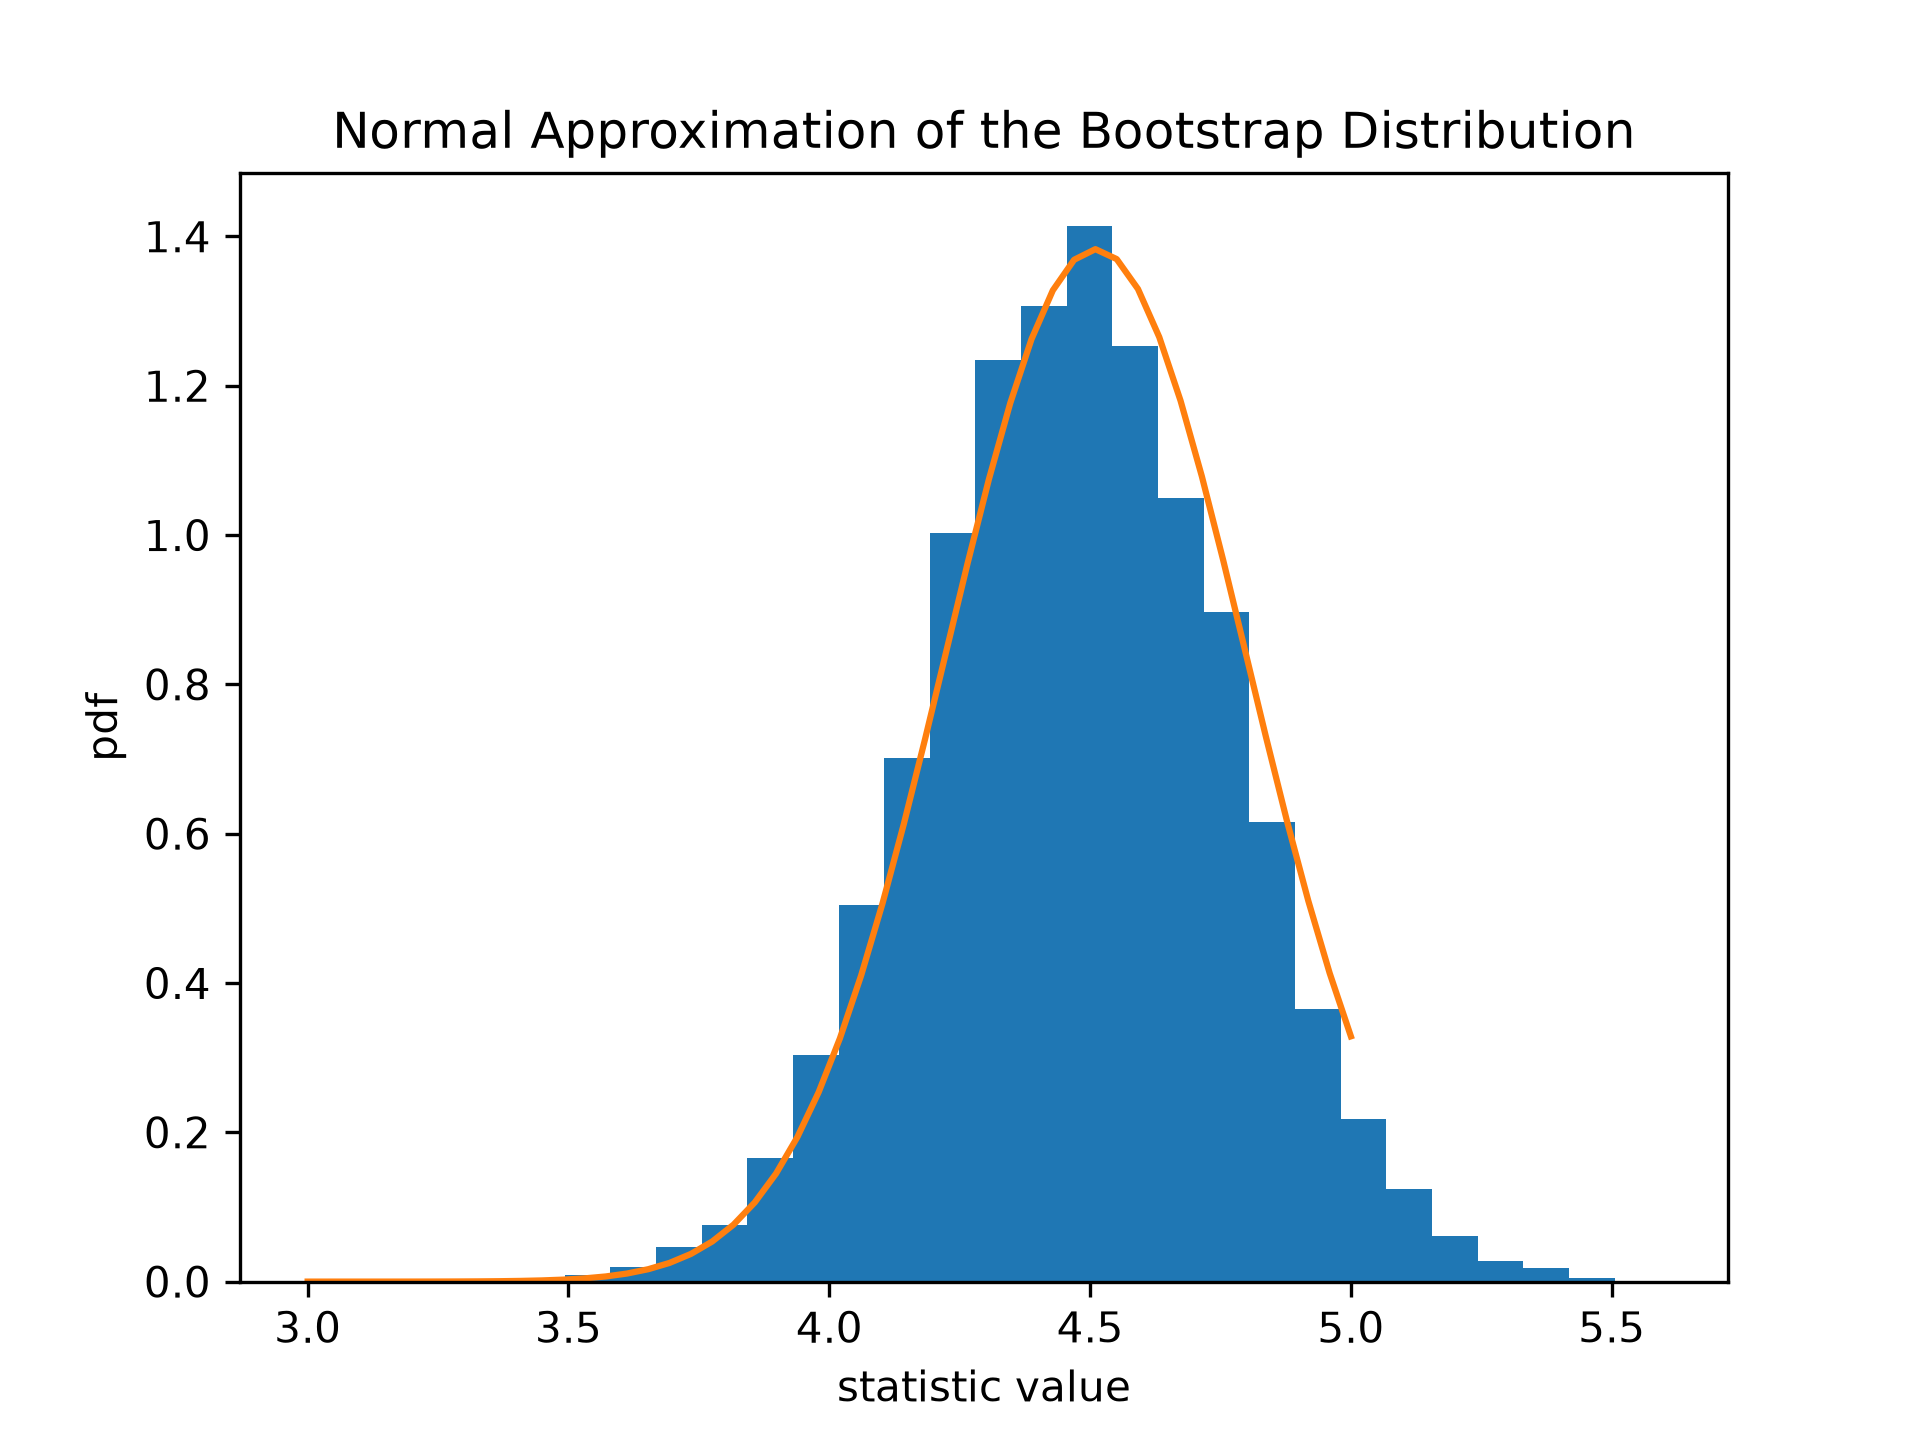
np.True_The bootstrap distribution of the statistic is often approximately normal with scale equal to the standard error.
x = np.linspace(3, 5)
pdf = norm.pdf(x, loc=std_sample, scale=res.standard_error)
fig, ax = plt.subplots()
✓
ax.hist(res.bootstrap_distribution, bins=25, density=True)
ax.plot(x, pdf)
ax.set_title('Normal Approximation of the Bootstrap Distribution')
ax.set_xlabel('statistic value')
ax.set_ylabel('pdf')
✗
Text(0, 0.5, 'pdf')
plt.show()
✓
norm.interval(0.9, loc=std_sample, scale=res.standard_error)
✗(np.float64(4.036422324436868), np.float64(4.985390184071269))Due to central limit theorem, this normal approximation is accurate for a variety of statistics and distributions underlying the samples; however, the approximation is not reliable in all cases. Because `bootstrap` is designed to work with arbitrary underlying distributions and statistics, it uses more advanced techniques to generate an accurate confidence interval.
print(res.confidence_interval)
✗ConfidenceInterval(low=np.float64(4.096528743341175), high=np.float64(5.05776707630471))If we sample from the original distribution 100 times and form a bootstrap confidence interval for each sample, the confidence interval contains the true value of the statistic approximately 90% of the time.
n_trials = 100
ci_contains_true_std = 0
for i in range(n_trials):
   data = (dist.rvs(size=100, random_state=rng),)
   res = bootstrap(data, np.std, confidence_level=0.9,
                   n_resamples=999, rng=rng)
   ci = res.confidence_interval
   if ci[0] < std_true < ci[1]:
       ci_contains_true_std += 1
✓
print(ci_contains_true_std)
✗90Rather than writing a loop, we can also determine the confidence intervals for all 100 samples at once.
data = (dist.rvs(size=(n_trials, 100), random_state=rng),)
res = bootstrap(data, np.std, axis=-1, confidence_level=0.9,
                n_resamples=999, rng=rng)
ci_l, ci_u = res.confidence_interval
✓
print(ci_l[:5])
print(ci_u[:5])
✗
[3.67079 4.70746 4.42485 4.98482 4.82633]And again, approximately 90% contain the true value, ``std_true = 4``.
print(np.sum((ci_l < std_true) & (std_true < ci_u)))
✗90`bootstrap` can also be used to estimate confidence intervals of multi-sample statistics. For example, to get a confidence interval for the difference between means, we write a function that accepts two sample arguments and returns only the statistic. The use of the ``axis`` argument ensures that all mean calculations are perform in a single vectorized call, which is faster than looping over pairs of resamples in Python.
def my_statistic(sample1, sample2, axis=-1):
    mean1 = np.mean(sample1, axis=axis)
    mean2 = np.mean(sample2, axis=axis)
    return mean1 - mean2
✓
sample1 = norm.rvs(scale=1, size=100, random_state=rng)
sample2 = norm.rvs(scale=2, size=100, random_state=rng)
data = (sample1, sample2)
res = bootstrap(data, my_statistic, method='basic', rng=rng)
✓
print(my_statistic(sample1, sample2))
print(res.confidence_interval)
✗
ConfidenceInterval(low=np.float64(-0.3510745535458074), high=np.float64(0.620786692447663))The bootstrap estimate of the standard error is also available.
print(res.standard_error)
✗0.24719203054535713Paired-sample statistics work, too. For example, consider the Pearson correlation coefficient.
from scipy.stats import pearsonr
n = 100
x = np.linspace(0, 10, n)
y = x + rng.uniform(size=n)
✓
print(pearsonr(x, y)[0]) # element 0 is the statistic
✗0.9958094126228576We wrap `pearsonr` so that it returns only the statistic, ensuring that we use the `axis` argument because it is available.
def my_statistic(x, y, axis=-1):
    return pearsonr(x, y, axis=axis)[0]
✓
res = bootstrap((x, y), my_statistic, paired=True, rng=rng)
✓print(res.confidence_interval)
✗ConfidenceInterval(low=np.float64(0.9944484231820774), high=np.float64(0.9967319578696644))The result object can be passed back into `bootstrap` to perform additional resampling:
len(res.bootstrap_distribution)
res = bootstrap((x, y), my_statistic, paired=True,
                n_resamples=1000, rng=rng,
                bootstrap_result=res)
len(res.bootstrap_distribution)
✓
10999or to change the confidence interval options:
res2 = bootstrap((x, y), my_statistic, paired=True,
                 n_resamples=0, rng=rng, bootstrap_result=res,
                 method='percentile', confidence_level=0.9)
np.testing.assert_equal(res2.bootstrap_distribution,
                        res.bootstrap_distribution)
✓
res.confidence_interval
✗ConfidenceInterval(low=np.float64(0.9944462074273099), high=np.float64(0.9967321359970698))without repeating computation of the original bootstrap distribution.
Aliases
scipy.stats.bootstrap