bundles / scipy 2.0.0.dev0+git20260907.41eeb59 / scipy / stats / _survival / ecdf
function
scipy.stats._survival:ecdf
source: build-install/usr/lib/python3.14/site-packages/scipy/stats/_survival.py:253
Signature
def ecdf(sample: npt.ArrayLike | CensoredData) → ECDFResultSummary
Empirical cumulative distribution function of a sample.
Extended Summary
The empirical cumulative distribution function (ECDF) is a step function estimate of the CDF of the distribution underlying a sample. This function returns objects representing both the empirical distribution function and its complement, the empirical survival function.
Parameters
sample: 1D array_like or `scipy.stats.CensoredData`Besides array_like, instances of scipy.stats.CensoredData containing uncensored and right-censored observations are supported. Currently, other instances of scipy.stats.CensoredData will result in a
NotImplementedError.
Returns
res: `~scipy.stats._result_classes.ECDFResult`An object with the following attributes.
cdf
An object representing the empirical cumulative distribution function.
sf
An object representing the empirical survival function.
The
cdfandsfattributes themselves have the following attributes.quantiles
The unique values in the sample that defines the empirical CDF/SF.
probabilities
The point estimates of the probabilities corresponding with
quantiles.
And the following methods:
evaluate(x) :
Evaluate the CDF/SF at the argument.
plot(ax) :
Plot the CDF/SF on the provided axes.
confidence_interval(confidence_level=0.95) :
Compute the confidence interval around the CDF/SF at the values in
quantiles.
Notes
When each observation of the sample is a precise measurement, the ECDF steps up by 1/len(sample) at each of the observations [1].
When observations are lower bounds, upper bounds, or both upper and lower bounds, the data is said to be "censored", and sample may be provided as an instance of scipy.stats.CensoredData.
For right-censored data, the ECDF is given by the Kaplan-Meier estimator [2]; other forms of censoring are not supported at this time.
Confidence intervals are computed according to the Greenwood formula or the more recent "Exponential Greenwood" formula as described in [4].
Examples
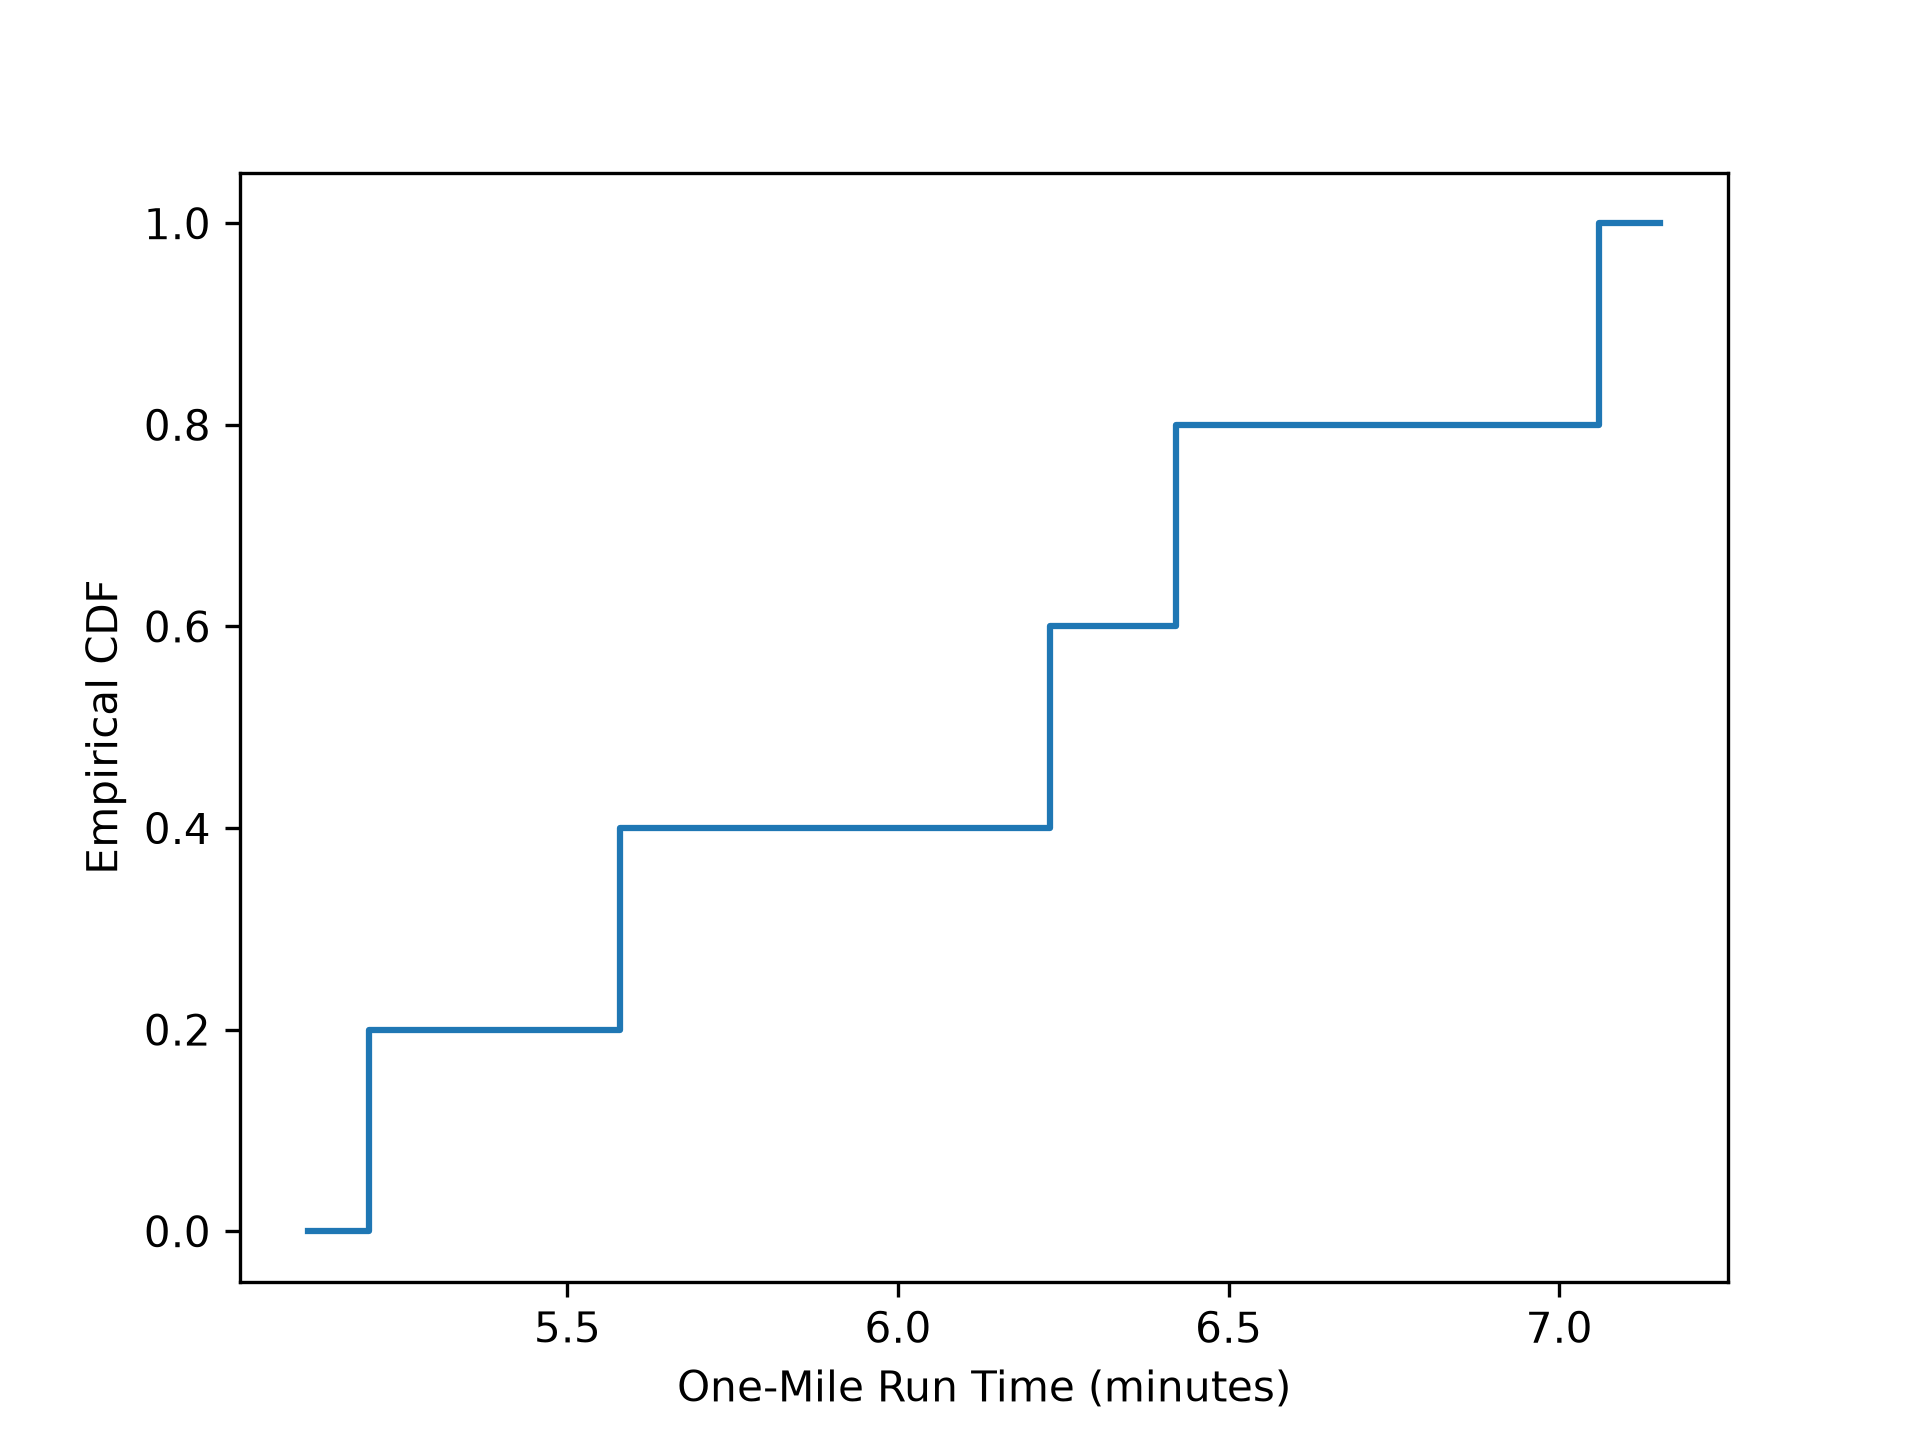
**Uncensored Data** As in the example from [1]_ page 79, five boys were selected at random from those in a single high school. Their one-mile run times were recorded as follows.sample = [6.23, 5.58, 7.06, 6.42, 5.20] # one-mile run times (minutes)
✓from scipy import stats res = stats.ecdf(sample) res.cdf.quantiles res.cdf.probabilities✓
array([0.2, 0.4, 0.6, 0.8, 1. ])To plot the result as a step function:
import matplotlib.pyplot as plt
ax = plt.subplot()
✓
res.cdf.plot(ax)
ax.set_xlabel('One-Mile Run Time (minutes)')
ax.set_ylabel('Empirical CDF')
✗
Text(0, 0.5, 'Empirical CDF')
plt.show()
✓
broken = [77, 47, 81, 56, 80]  # in thousands of miles driven
unbroken = [62, 60, 43, 71, 37]
✓
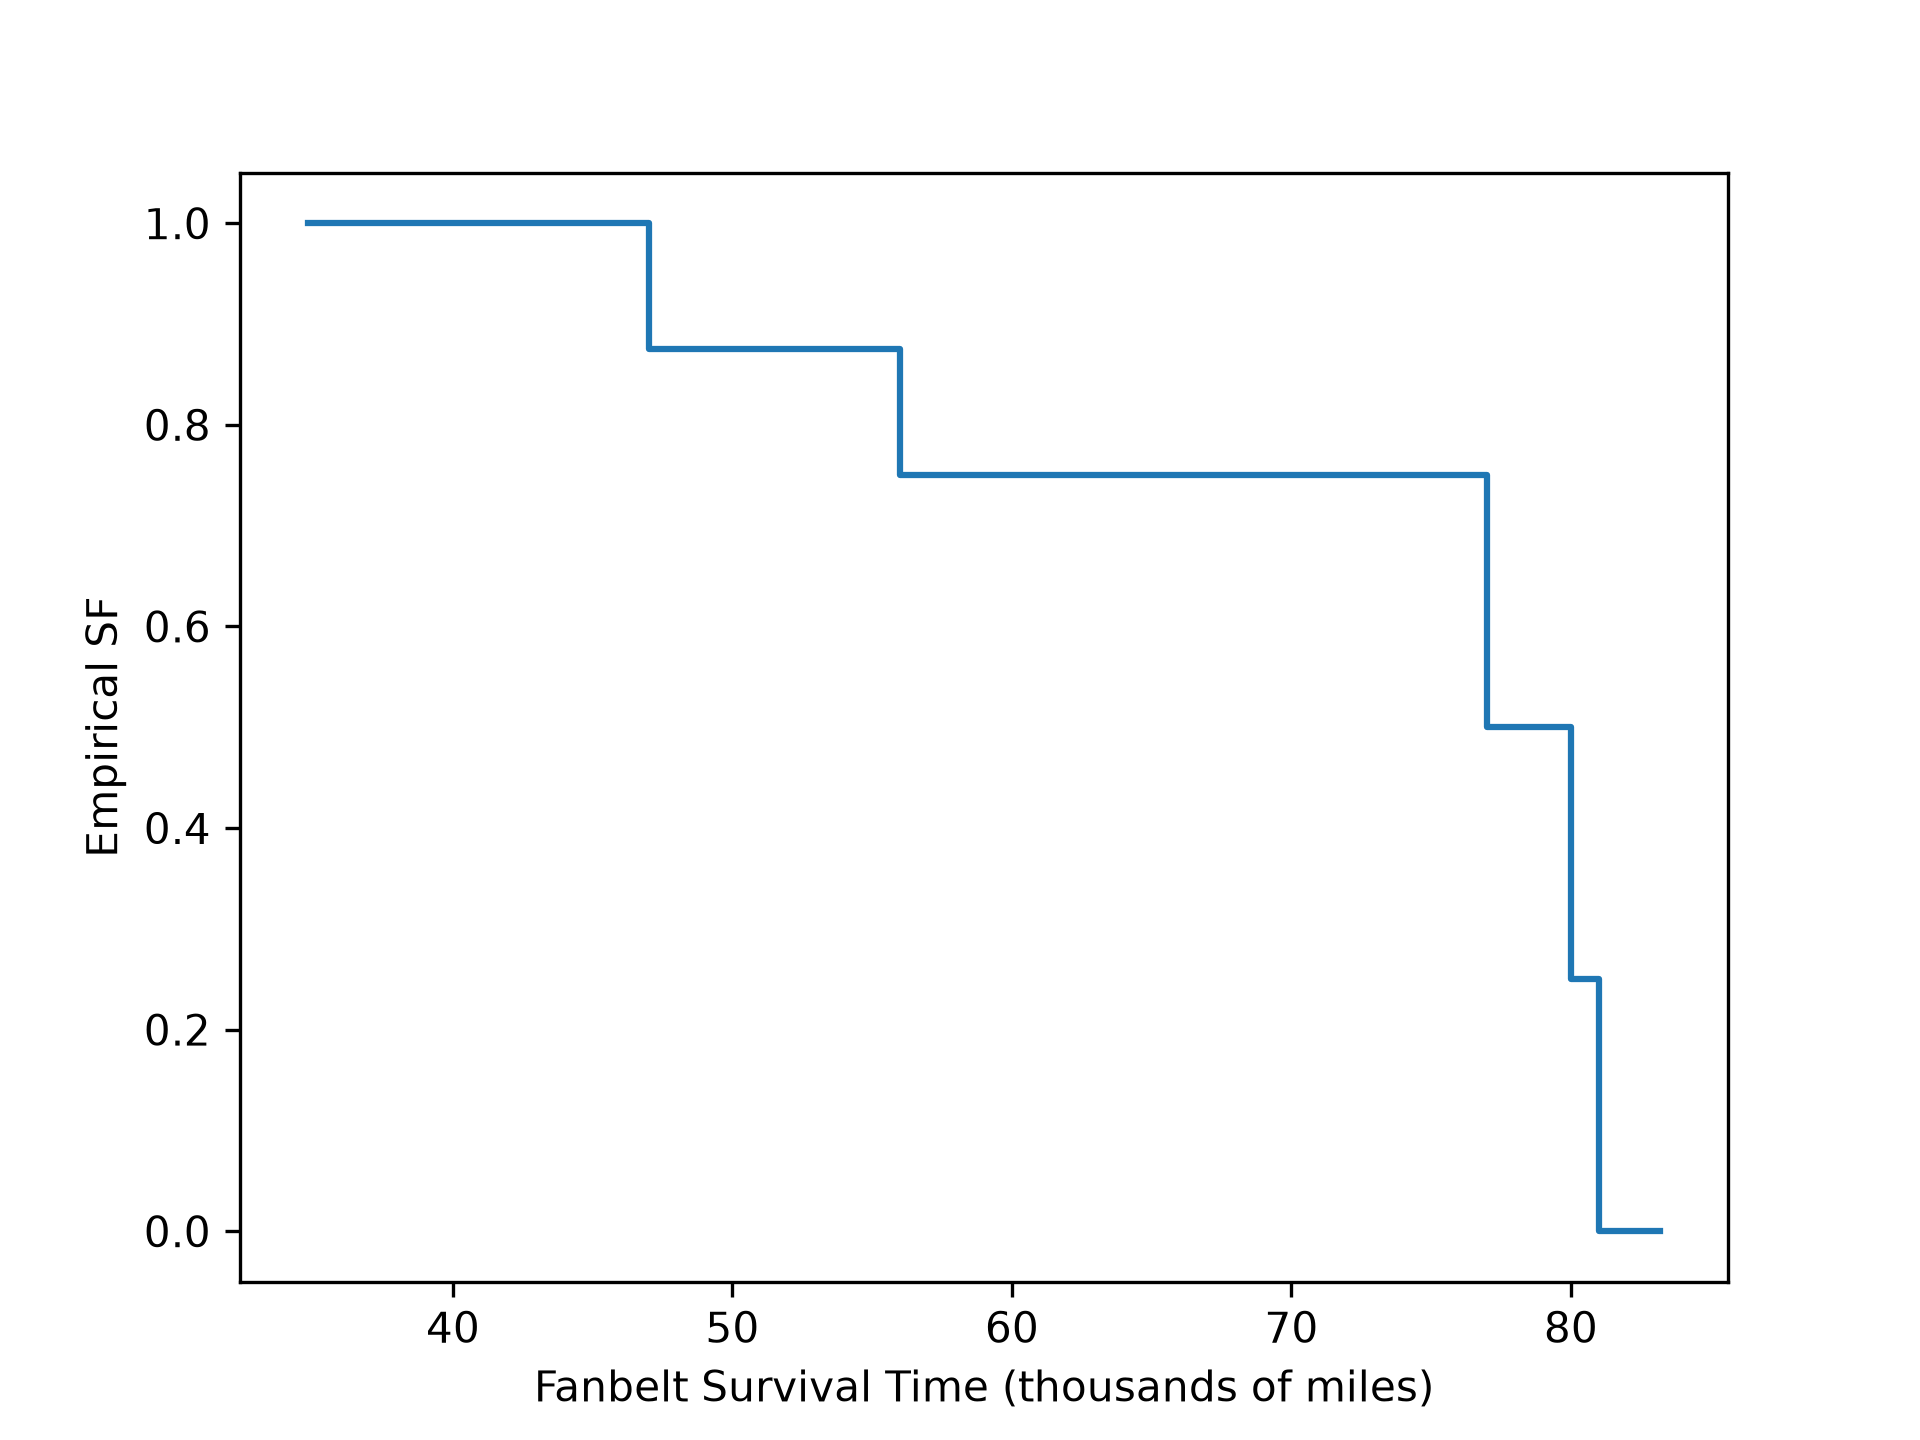
sample = stats.CensoredData(uncensored=broken, right=unbroken)
✓res = stats.ecdf(sample) res.sf.quantiles✓
array([37., 43., 47., 56., 60., 62., 71., 77., 80., 81.])
res.sf.probabilities
✗array([1. , 1. , 0.875, 0.75 , 0.75 , 0.75 , 0.75 , 0.5 , 0.25 ,
0. ])
To plot the result as a step function:
ax = plt.subplot()
✓res.sf.plot(ax) ax.set_xlabel('Fanbelt Survival Time (thousands of miles)') ax.set_ylabel('Empirical SF')✗
Text(0, 0.5, 'Empirical SF')
plt.show()
✓
Aliases
scipy.stats.ecdf