bundles / scipy 1.17.1 / scipy / interpolate / _bary_rational / FloaterHormannInterpolator
class
scipy.interpolate._bary_rational:FloaterHormannInterpolator
Signature
class FloaterHormannInterpolator ( points , values , * , d = 3 , axis = 0 ) Members
Summary
Floater-Hormann barycentric rational interpolator (C∞ smooth on real axis).
Extended Summary
As described in [1], the method of Floater and Hormann computes weights for a barycentric rational interpolant with no poles on the real axis.
Parameters
x: 1D array_like, shape (n,)1-D array containing values of the independent variable. Values may be real or complex but must be finite.
y: array_like, shape (n, ...)Array containing values of the dependent variable. Infinite and NaN values of y and corresponding values of x will be discarded.
d: int, default: 3Integer satisfying
0 <= d < n. Floater-Hormann interpolation blendsn - dpolynomials of degreedtogether; ford = n - 1, this is equivalent to polynomial interpolation.axis: int, default: 0Axis of y corresponding to x.
Attributes
weights: arrayWeights of the barycentric approximation.
Notes
The Floater-Hormann interpolant is a rational function that interpolates the data with approximation order . The rational function blends n - d polynomials of degree d together to produce a rational interpolant that contains no poles on the real axis, unlike AAA. The interpolant is given by
where is an interpolating polynomial of at most degree d through the points , and are blending functions defined by
When d = n - 1 this reduces to polynomial interpolation.
Due to its stability, the following barycentric representation of the above equation is used for computation
where the weights are computed as
Examples
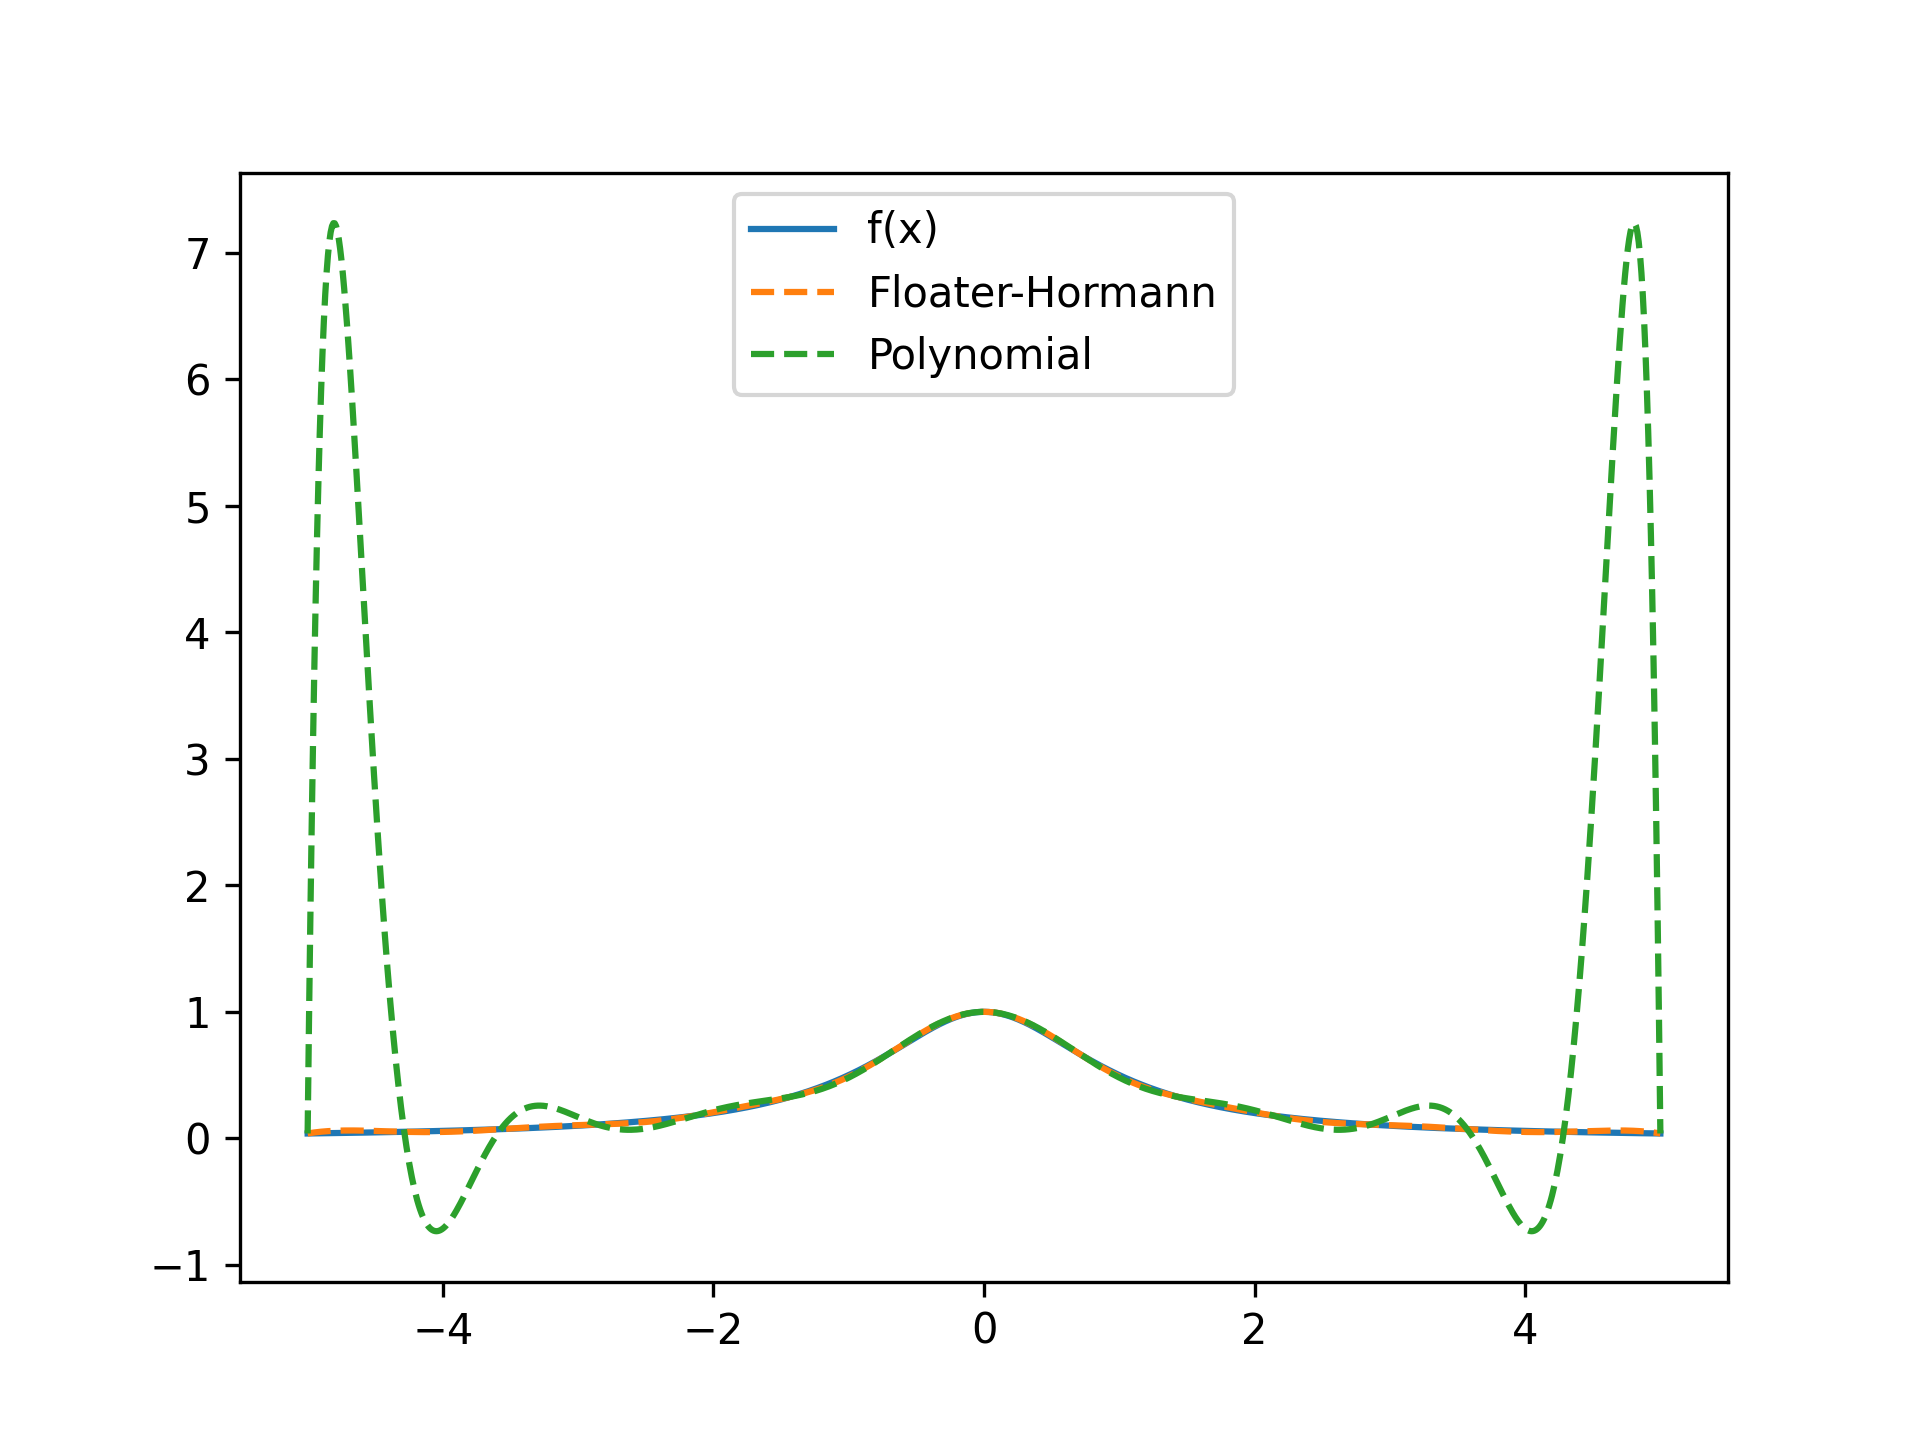
Here we compare the method against polynomial interpolation for an example where the polynomial interpolation fails due to Runge's phenomenon.import numpy as np from scipy.interpolate import (FloaterHormannInterpolator, BarycentricInterpolator) def f(x): return 1/(1 + x**2) x = np.linspace(-5, 5, num=15) r = FloaterHormannInterpolator(x, f(x)) p = BarycentricInterpolator(x, f(x)) xx = np.linspace(-5, 5, num=1000) import matplotlib.pyplot as plt fig, ax = plt.subplots()✓
ax.plot(xx, f(xx), label="f(x)")
ax.plot(xx, r(xx), "--", label="Floater-Hormann")
ax.plot(xx, p(xx), "--", label="Polynomial")
ax.legend()
✗
plt.show()
✓
See also
Aliases
-
scipy.interpolate.FloaterHormannInterpolator