bundles / scipy 1.17.1 / scipy / stats / _mstats_basic / linregress
function
scipy.stats._mstats_basic:linregress
Signature
def linregress ( x , y = None ) Summary
Calculate a linear least-squares regression for two sets of measurements.
Parameters
x, y: array_likeTwo sets of measurements. Both arrays should have the same length N. If only
xis given (andy=None), then it must be a two-dimensional array where one dimension has length 2. The two sets of measurements are then found by splitting the array along the length-2 dimension. In the case wherey=Noneandxis a 2xN array,linregress(x)is equivalent tolinregress(x[0], x[1]).
Returns
result: ``LinregressResult`` instanceThe return value is an object with the following attributes:
slope
slope
intercept
intercept
rvalue
rvalue
pvalue
pvalue
stderr
stderr
intercept_stderr
intercept_stderr
Notes
Missing values are considered pair-wise: if a value is missing in x, the corresponding value in y is masked.
For compatibility with older versions of SciPy, the return value acts like a namedtuple of length 5, with fields slope, intercept, rvalue, pvalue and stderr, so one can continue to write
slope, intercept, r, p, se = linregress(x, y)With that style, however, the standard error of the intercept is not available. To have access to all the computed values, including the standard error of the intercept, use the return value as an object with attributes, e.g.
result = linregress(x, y)
print(result.intercept, result.intercept_stderr)
Examples
import numpy as np
import matplotlib.pyplot as plt
from scipy import stats
rng = np.random.default_rng()
✓
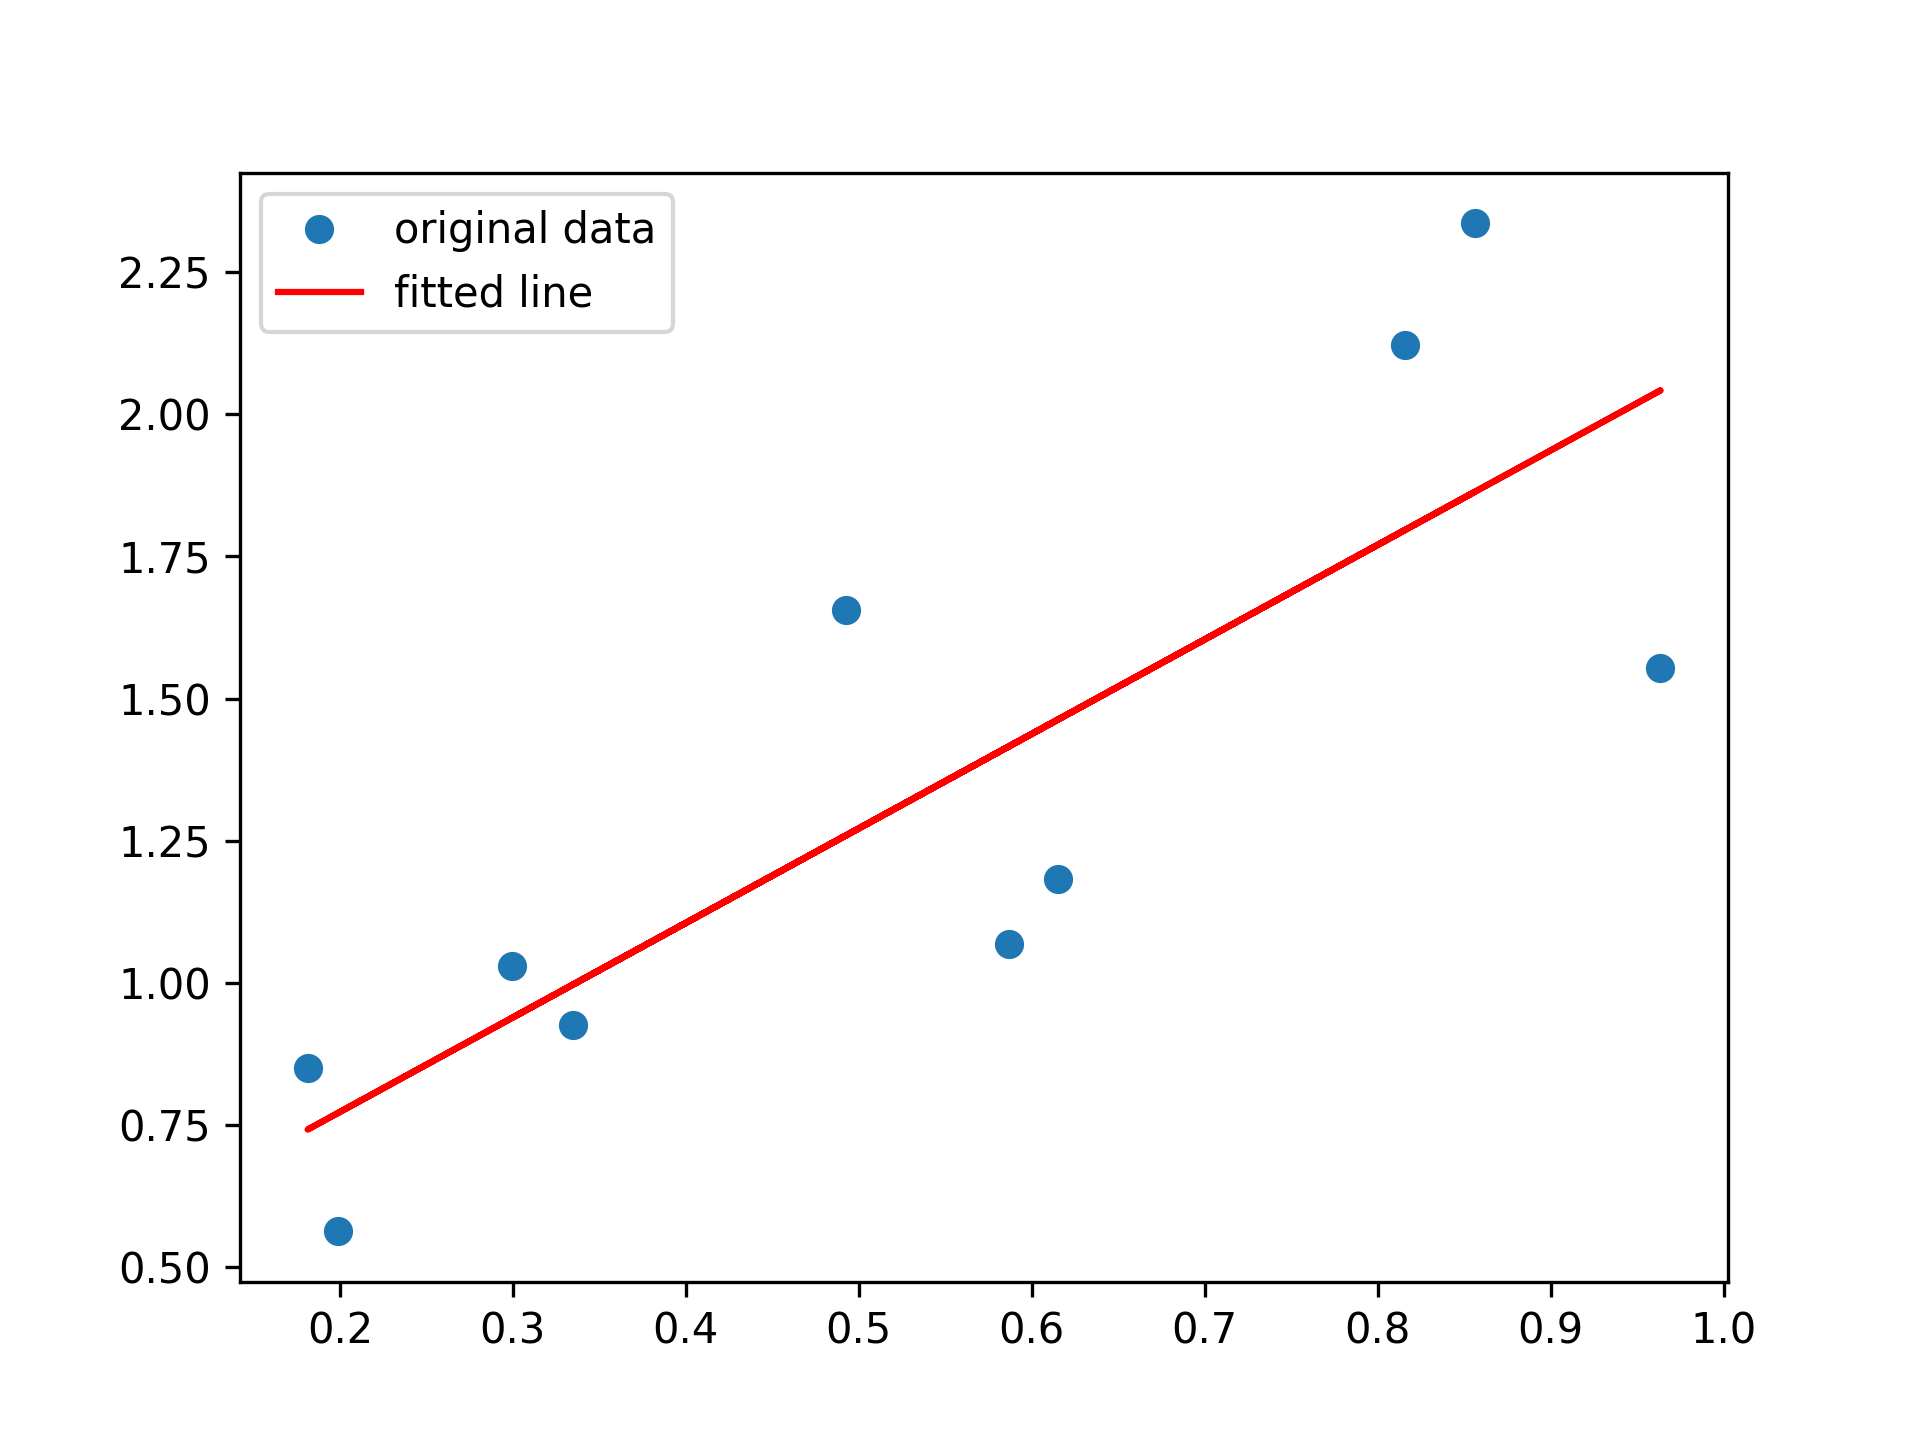
x = rng.random(10)
y = 1.6*x + rng.random(10)
✓
res = stats.mstats.linregress(x, y)
✓print(f"R-squared: {res.rvalue**2:.6f}")
✗plt.plot(x, y, 'o', label='original data') plt.plot(x, res.intercept + res.slope*x, 'r', label='fitted line') plt.legend()✗
plt.show()
✓
from scipy.stats import t
tinv = lambda p, df: abs(t.ppf(p/2, df))
✓
ts = tinv(0.05, len(x)-2)
✓print(f"slope (95%): {res.slope:.6f} +/- {ts*res.stderr:.6f}") print(f"intercept (95%): {res.intercept:.6f}" f" +/- {ts*res.intercept_stderr:.6f}")✗
See also
- scipy.optimize.curve_fit
Use non-linear least squares to fit a function to data.
- scipy.optimize.leastsq
Minimize the sum of squares of a set of equations.
Aliases
-
scipy.stats._mstats_basic.linregress