bundles / scipy 1.17.1 / scipy / stats / _qmc / MultinomialQMC
class
scipy.stats._qmc:MultinomialQMC
source: /scipy/stats/_qmc.py :2486
Signature
class MultinomialQMC ( pvals : npt.ArrayLike , n_trials : int | numpy.integer , * , engine : scipy.stats._qmc.QMCEngine | None = None , rng : int | numpy.integer | numpy.random._generator.Generator | numpy.random.mtrand.RandomState | None = None , seed = None ) → None Members
Summary
QMC sampling from a multinomial distribution.
Parameters
pvals: array_like (k,)Vector of probabilities of size
k, wherekis the number of categories. Elements must be non-negative and sum to 1.n_trials: intNumber of trials.
engine: QMCEngine, optionalQuasi-Monte Carlo engine sampler. If None, Sobol is used.
rng: `numpy.random.Generator`, optionalPseudorandom number generator state. When
rngis None, a new numpy.random.Generator is created using entropy from the operating system. Types other than numpy.random.Generator are passed to numpy.random.default_rng to instantiate aGenerator.
Examples
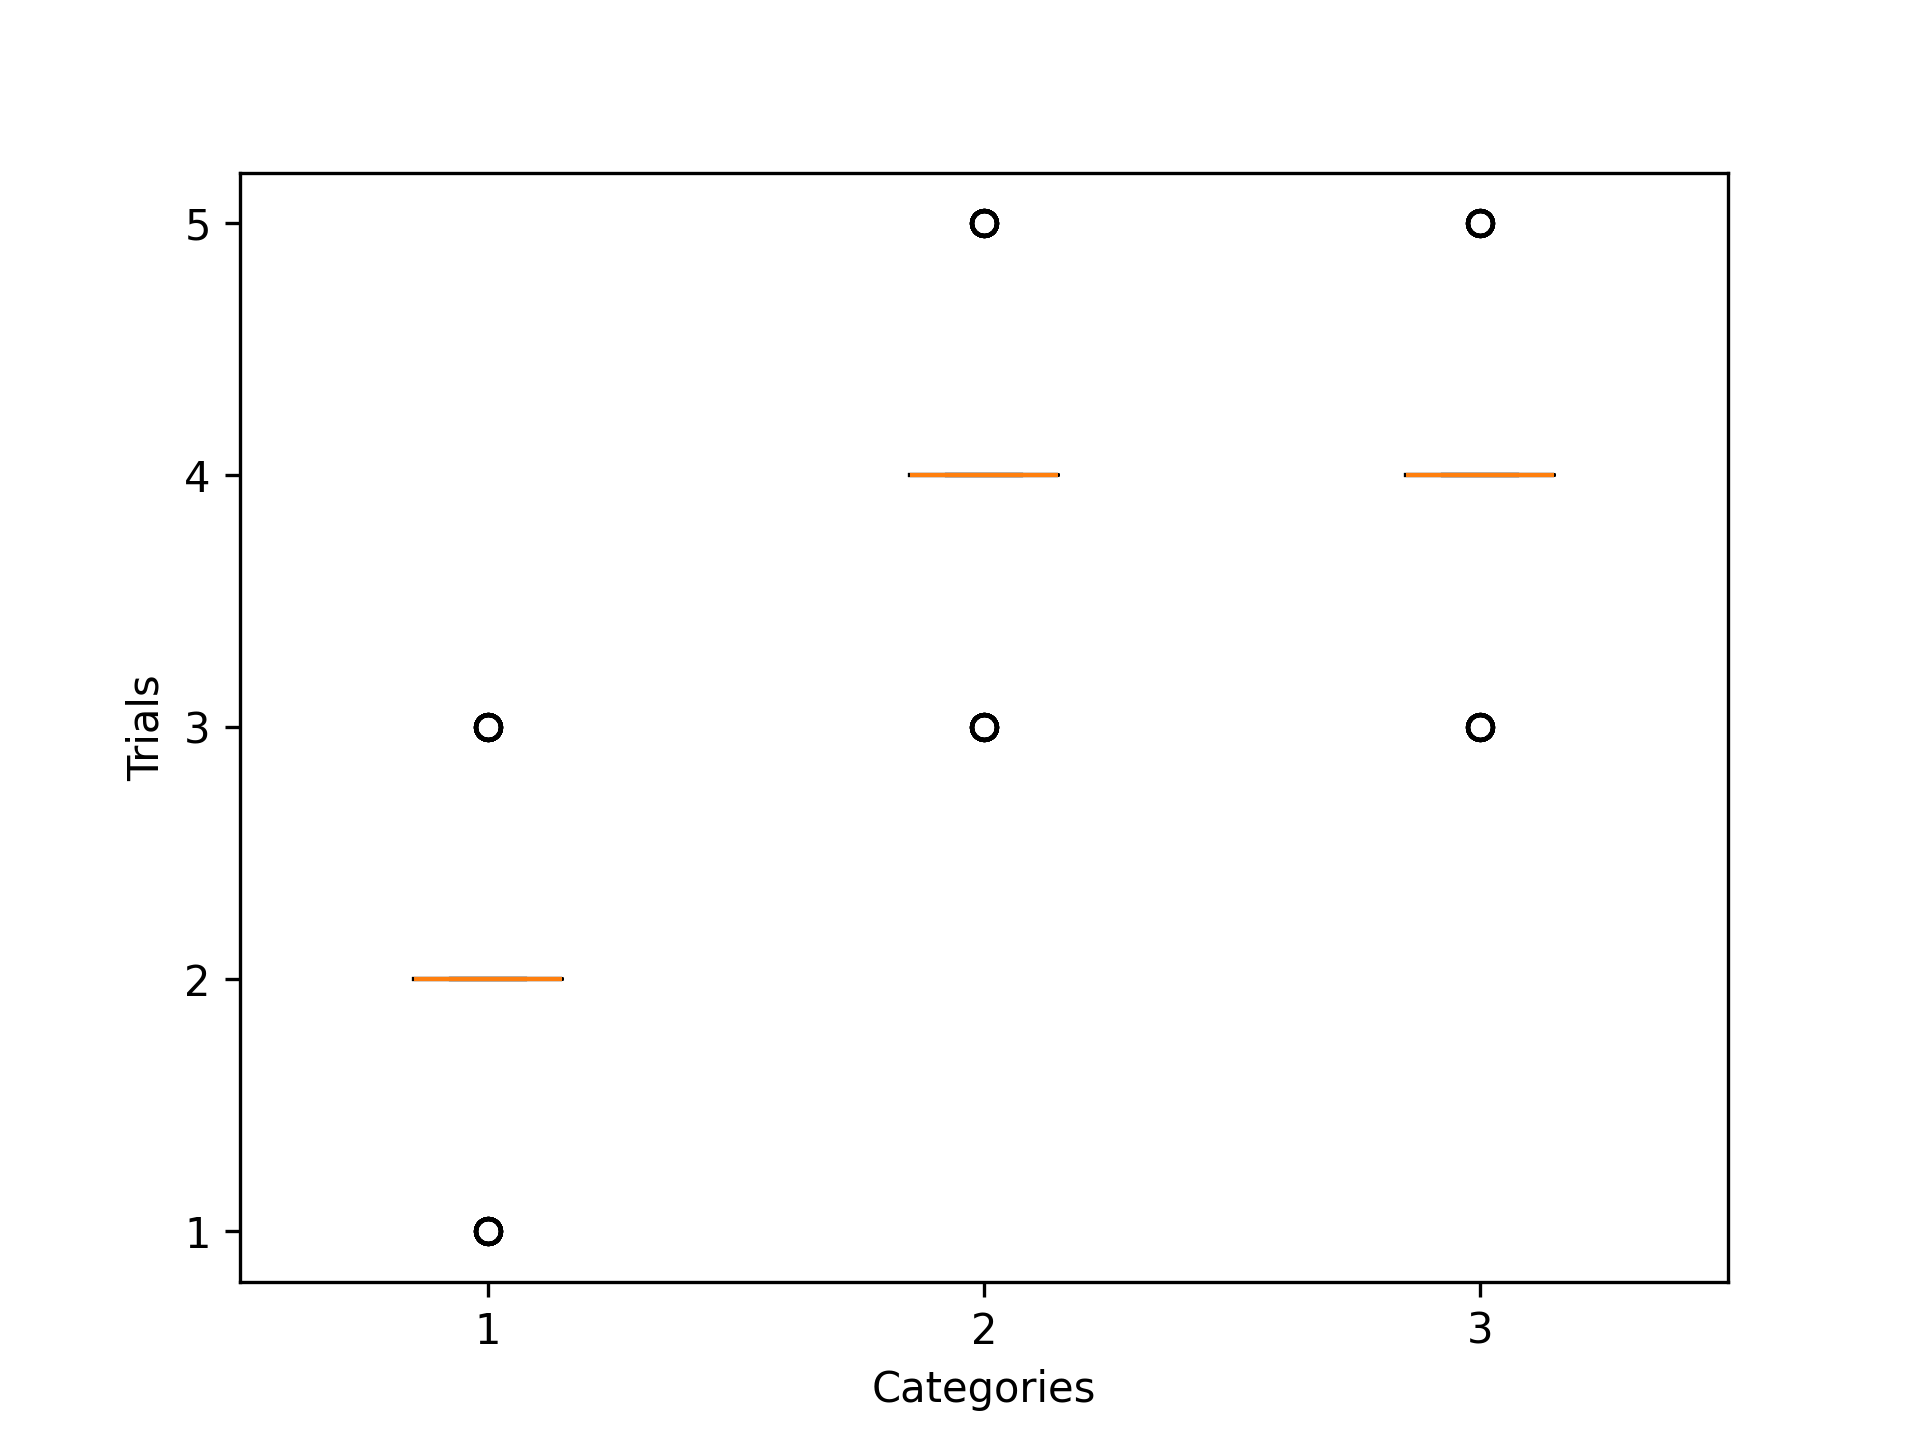
Let's define 3 categories and for a given sample, the sum of the trials of each category is 8. The number of trials per category is determined by the `pvals` associated to each category. Then, we sample this distribution 64 times.import matplotlib.pyplot as plt from scipy.stats import qmc dist = qmc.MultinomialQMC( pvals=[0.2, 0.4, 0.4], n_trials=10, engine=qmc.Halton(d=1) ) sample = dist.random(64)✓
fig, ax = plt.subplots()
ax.yaxis.get_major_locator().set_params(integer=True)
_ = ax.boxplot(sample)
✓
ax.set(xlabel="Categories", ylabel="Trials")
✗plt.show()
✓
Aliases
-
scipy.stats._qmc.MultinomialQMC