bundles / scipy 1.18.0 / scipy / stats / _distribution_infrastructure / OrderStatisticDistribution
ABCMeta
scipy.stats._distribution_infrastructure:OrderStatisticDistribution
Signature
def OrderStatisticDistribution(dist, /, *args, r, n, **kwargs)Members
Summary
Probability distribution of an order statistic.
Extended Summary
An instance of this class represents a random variable that follows the distribution of the order statistic of a sample of observations of a random variable .
Parameters
dist: `ContinuousDistribution`The random variable .
n: array_likeThe (positive integer) sample size .
r: array_likeThe (positive integer) rank of the order statistic , satisfying .
Notes
If we make observations of a continuous random variable and sort them in increasing order , then is known as the order statistic.
If the PDF, CDF, and CCDF of are denoted by , , and , respectively, then the PDF of is given by:
The CDF and other methods of the distribution of are calculated using the fact that , where is a standard uniform random variable, together with the fact that the order statistics of i.i.d. uniform random variables follow a beta distribution .
Examples
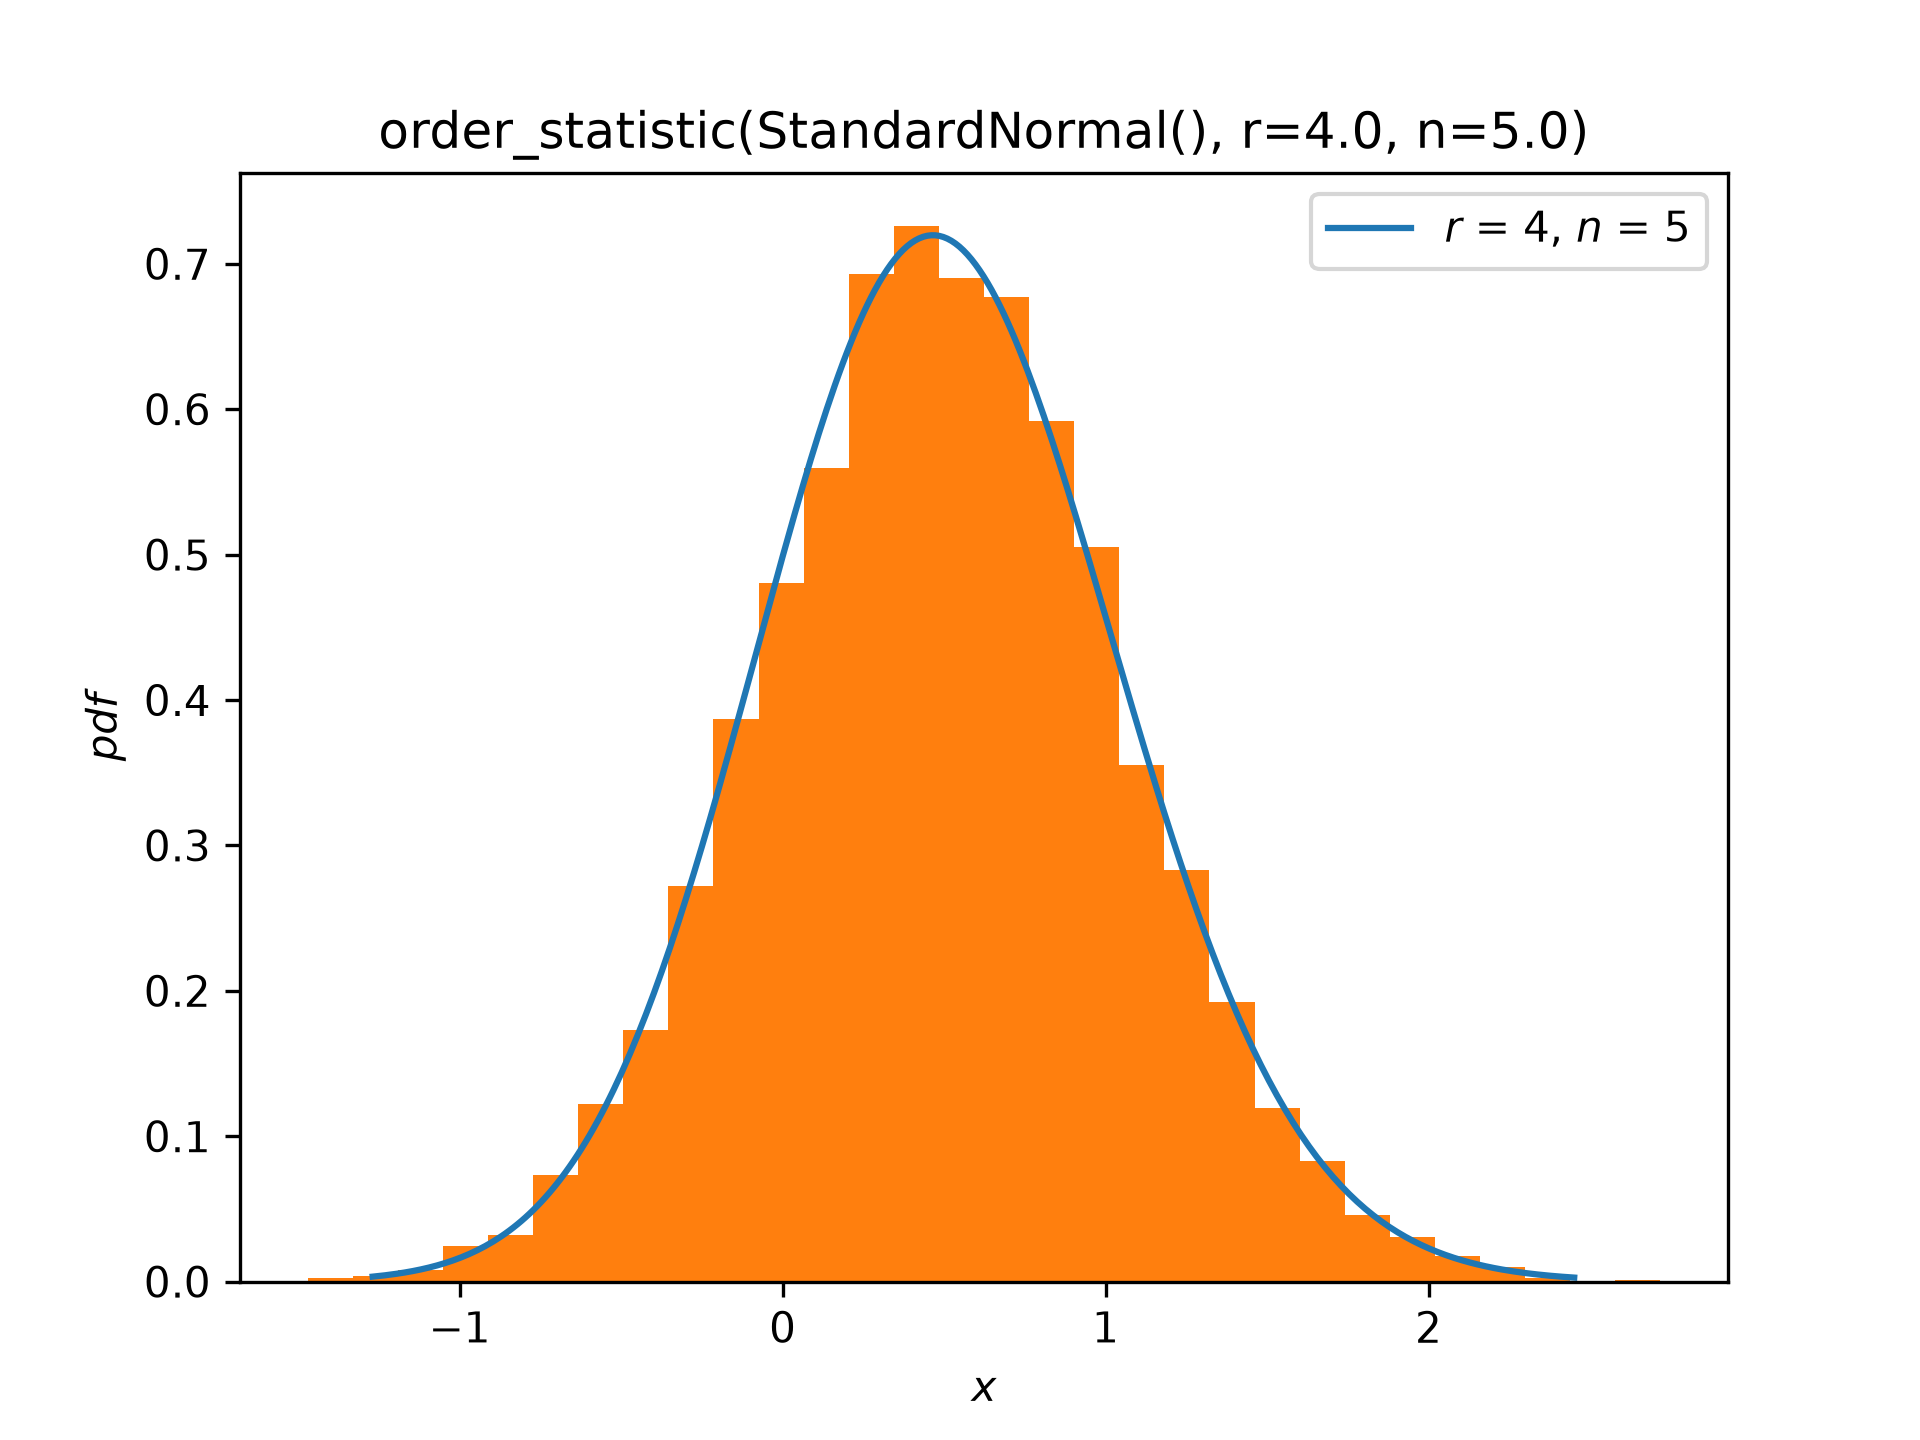
Suppose we are interested in order statistics of samples of size five drawn from the standard normal distribution. Plot the PDF of the fourth order statistic and compare with a normalized histogram from simulation.import numpy as np import matplotlib.pyplot as plt from scipy import stats from scipy.stats._distribution_infrastructure import OrderStatisticDistribution X = stats.Normal() data = X.sample(shape=(10000, 5)) sorted_data = np.sort(data, axis=1) Y = OrderStatisticDistribution(X, r=4, n=5) ax = plt.gca()✓
Y.plot(ax=ax)
ax.hist(sorted_data[:, 3], density=True, bins=30)
✗
(array([0.00215, 0.00358, 0.00788, 0.02435, 0.03223, 0.07306, 0.12248,
       0.17333, 0.27217, 0.38677, 0.48059, 0.55938, 0.69332, 0.72626,
       0.69045, 0.67684, 0.59161, 0.50495, 0.35525, 0.28291, 0.19195,
       0.11961, 0.08308, 0.04584, 0.0308 , 0.01791, 0.01003, 0.00215,
       0.     , 0.00143]), array([-1.47076, -1.33114, -1.19152, -1.0519 , -0.91228, -0.77267,
       -0.63305, -0.49343, -0.35381, -0.21419, -0.07457,  0.06505,
        0.20466,  0.34428,  0.4839 ,  0.62352,  0.76314,  0.90276,
        1.04238,  1.18199,  1.32161,  1.46123,  1.60085,  1.74047,
        1.88009,  2.01971,  2.15932,  2.29894,  2.43856,  2.57818,
        2.7178 ]), <BarContainer object of 30 artists>)
plt.show()
✓
Aliases
scipy.stats._distribution_infrastructure.OrderStatisticDistribution