bundles / scipy 1.18.0 / scipy / stats / _distribution_infrastructure / order_statistic
function
scipy.stats._distribution_infrastructure:order_statistic
Signature
def order_statistic(X, /, r, n)Summary
Probability distribution of an order statistic.
Extended Summary
Returns a random variable that follows the distribution of the order statistic of a sample of observations of a random variable .
Parameters
X: `ContinuousDistribution`The random variable .
r: array_likeThe (positive integer) rank of the order statistic , satisfying
1 <= r <= n.n: array_likeThe (positive integer) sample size .
Returns
Y: `ContinuousDistribution`A random variable that follows the distribution of the prescribed order statistic.
Notes
If we make observations of a continuous random variable and sort them in increasing order , then is known as the order statistic.
If the PDF, CDF, and CCDF of are denoted by , , and , respectively, then the PDF of is given by:
The CDF and other methods of the distribution of are calculated using the fact that , where is a standard uniform random variable, together with the fact that the order statistics of i.i.d. uniform random variables follow a beta distribution .
Examples
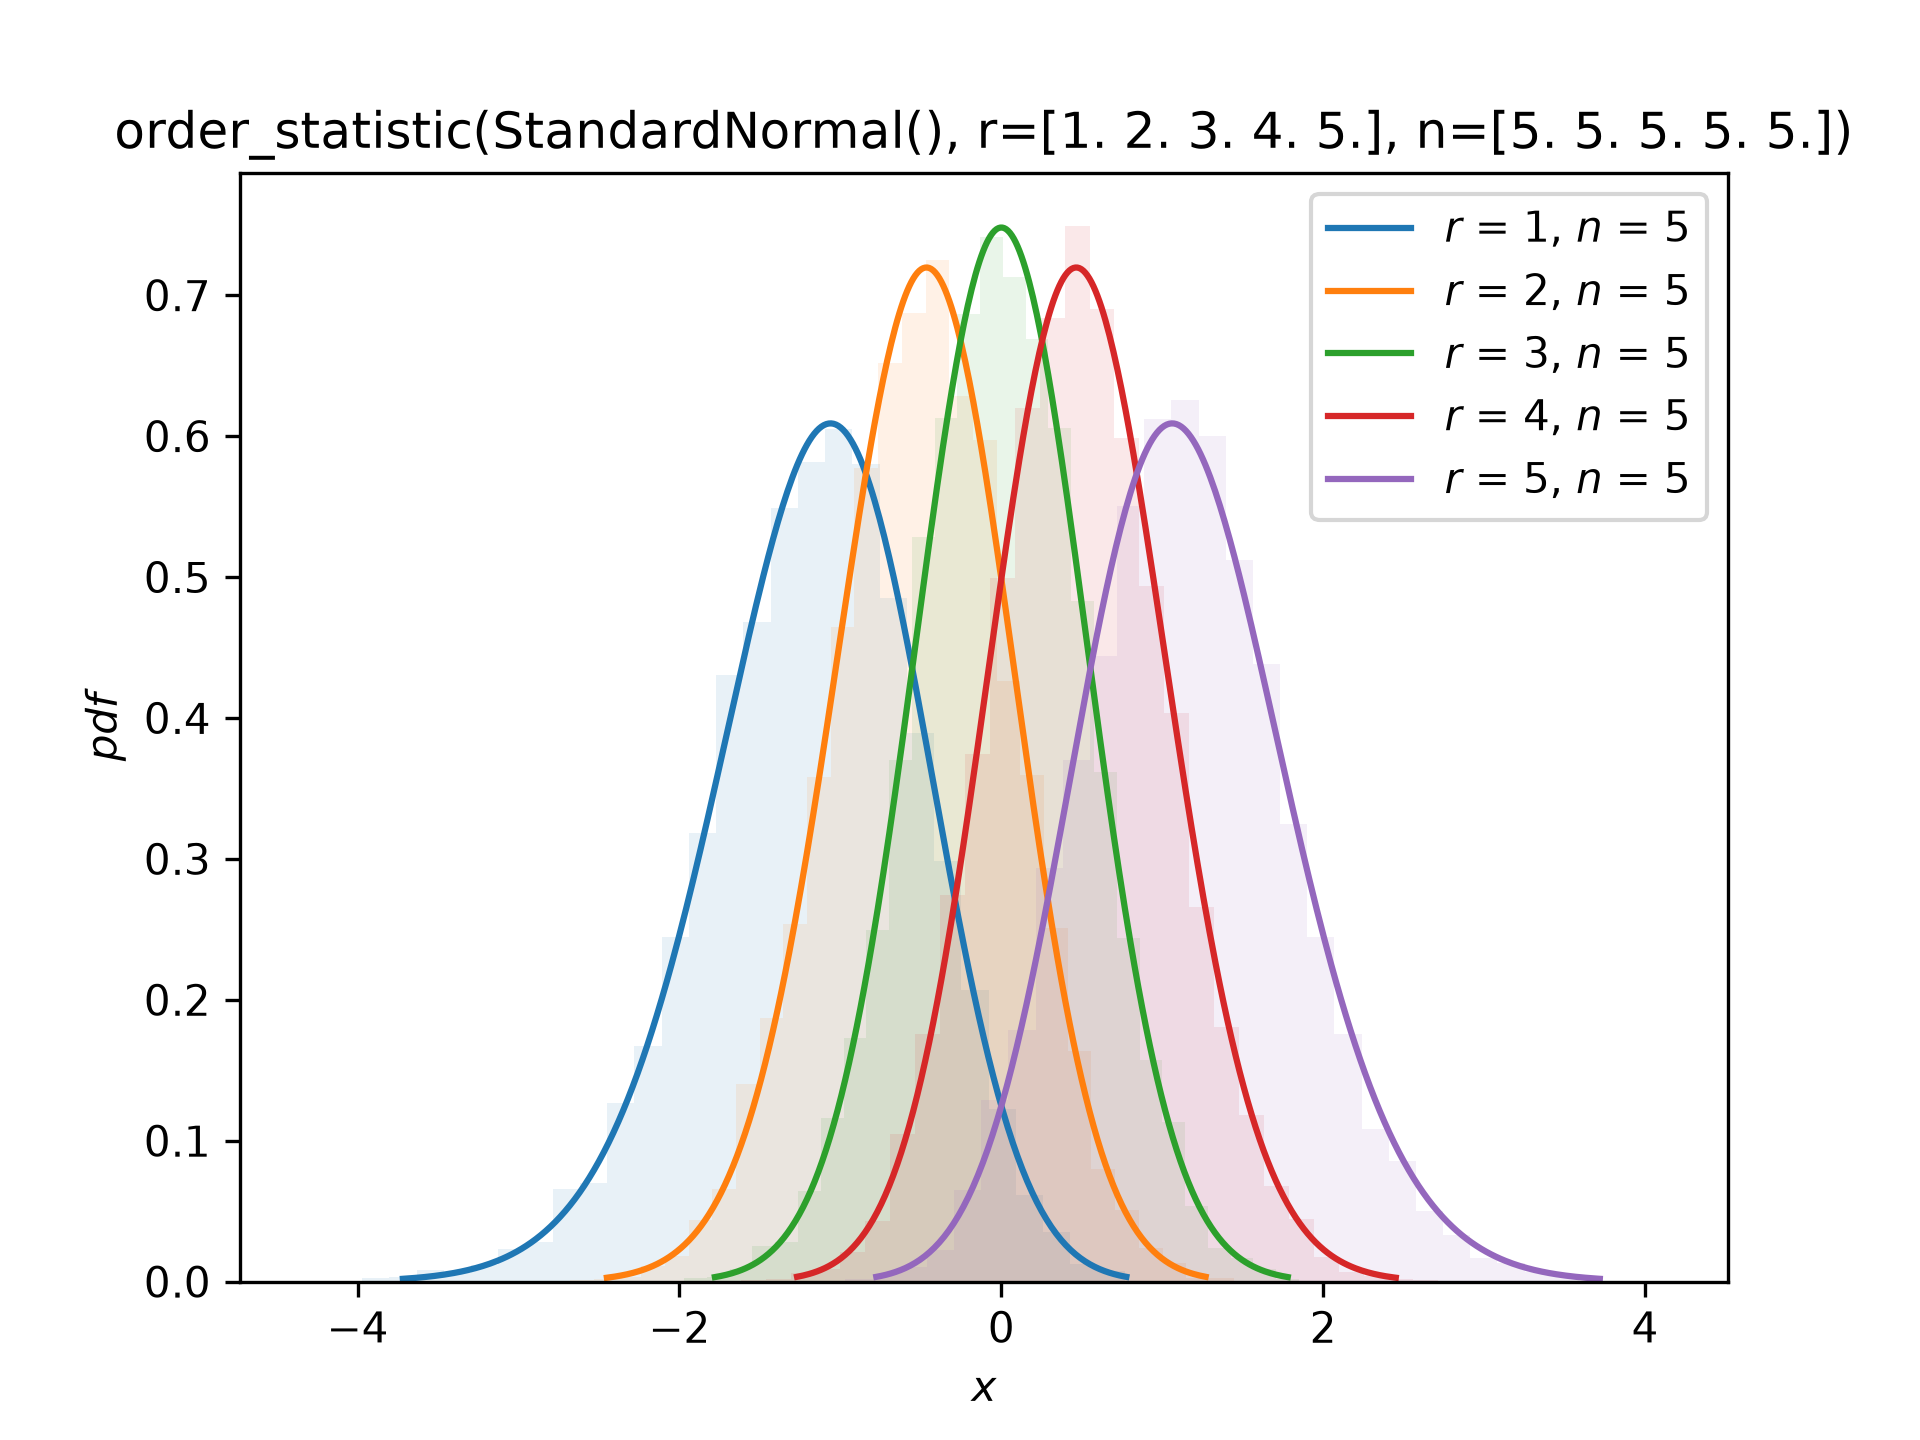
Suppose we are interested in order statistics of samples of size five drawn from the standard normal distribution. Plot the PDF of each order statistic and compare with a normalized histogram from simulation.import numpy as np import matplotlib.pyplot as plt from scipy import stats X = stats.Normal() data = X.sample(shape=(10000, 5)) sorted_data = np.sort(data, axis=1) Y = stats.order_statistic(X, r=[1, 2, 3, 4, 5], n=5) ax = plt.gca() colors = plt.rcParams['axes.prop_cycle'].by_key()['color']✓
for i in range(5):
    y = sorted_data[:, i]
    ax.hist(y, density=True, bins=30, alpha=0.1, color=colors[i])
Y.plot(ax=ax)
✗
<Axes: title={'center': 'order_statistic(StandardNormal(), r=[1. 2. 3. 4. 5.], n=[5. 5. 5. 5. 5.])'}, xlabel='$x$', ylabel='$pdf$'>
plt.show()
✓
Aliases
scipy.stats.order_statistic