bundles / scipy 2.0.0.dev0+git20260907.41eeb59 / scipy / optimize / _optimize / rosen
function
scipy.optimize._optimize:rosen
source: build-install/usr/lib/python3.14/site-packages/scipy/optimize/_optimize.py:343
Signature
def rosen(x)Summary
The Rosenbrock function.
Extended Summary
The function computed is
sum(100.0*(x[1:] - x[:-1]**2.0)**2.0 + (1 - x[:-1])**2.0)Parameters
x: array_like1-D array of points at which the Rosenbrock function is to be computed.
Returns
f: floatThe value of the Rosenbrock function.
Examples
import numpy as np
from scipy.optimize import rosen
X = 0.1 * np.arange(10)
✓
rosen(X)
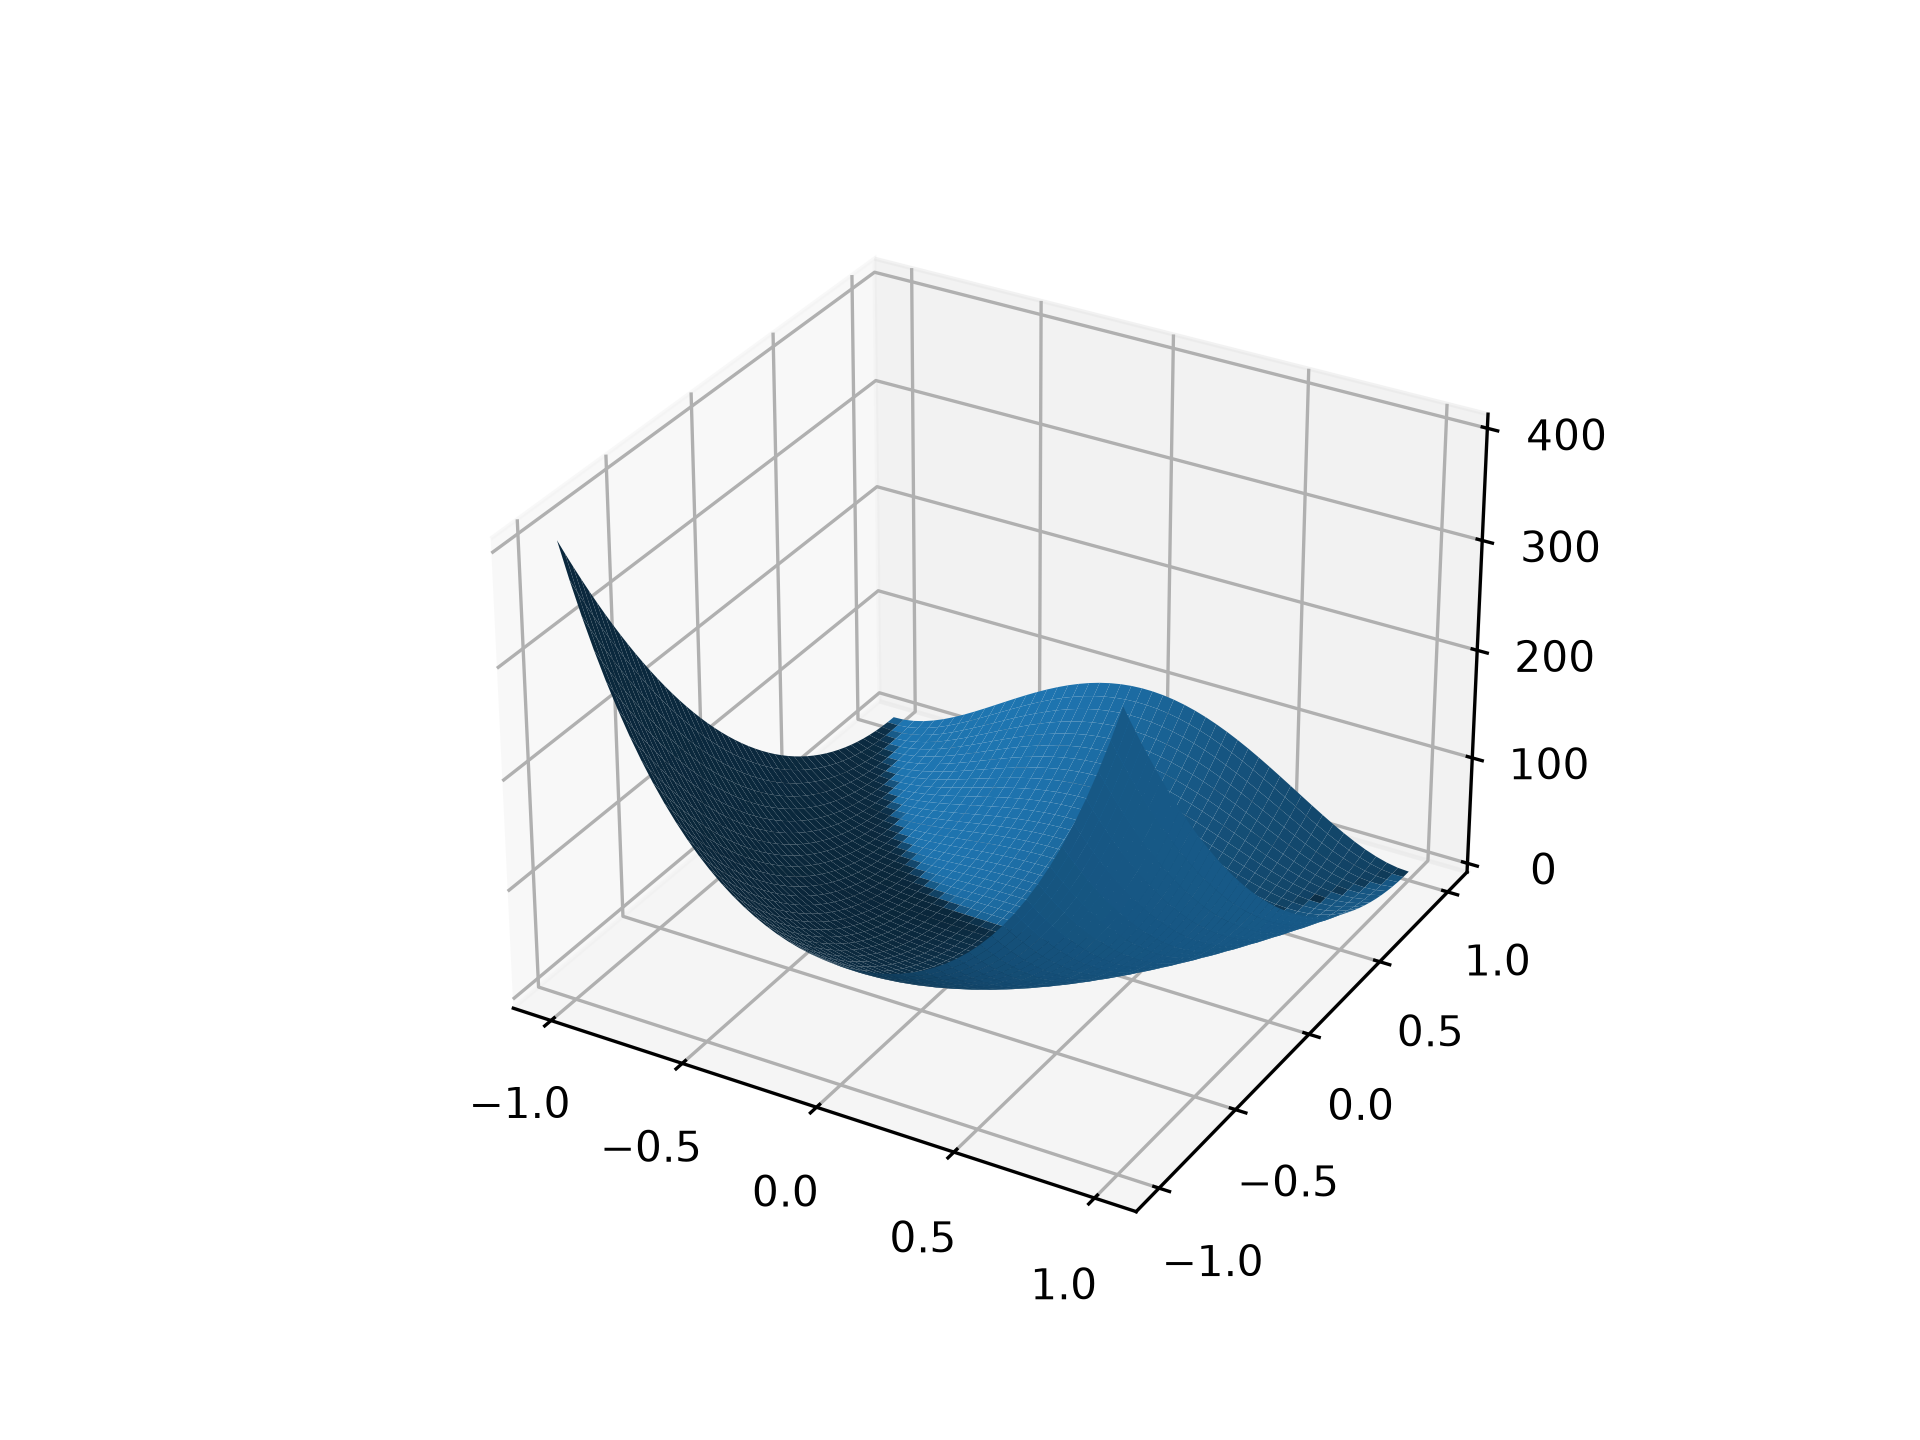
✗np.float64(76.56)For higher-dimensional input ``rosen`` broadcasts. In the following example, we use this to plot a 2D landscape. Note that ``rosen_hess`` does not broadcast in this manner.
import matplotlib.pyplot as plt
from mpl_toolkits.mplot3d import Axes3D
x = np.linspace(-1, 1, 50)
X, Y = np.meshgrid(x, x)
ax = plt.subplot(111, projection='3d')
✓
ax.plot_surface(X, Y, rosen([X, Y]))
✗<mpl_toolkits.mplot3d.art3d.Poly3DCollection object at 0x7f3f59d1ca50>
plt.show()
✓
See also
Aliases
scipy.optimize.rosen