bundles / scipy latest / scipy / cluster / vq / kmeans2
function
scipy.cluster.vq:kmeans2
source: /scipy/cluster/vq.py :648
Signature
def kmeans2 ( data , k , iter = 10 , thresh = 1e-05 , minit = random , missing = warn , check_finite = True , * , rng = None , seed = None ) Summary
Classify a set of observations into k clusters using the k-means algorithm.
Extended Summary
The algorithm attempts to minimize the Euclidean distance between observations and centroids. Several initialization methods are included.
Parameters
data: ndarrayA 'M' by 'N' array of 'M' observations in 'N' dimensions or a length 'M' array of 'M' 1-D observations.
k: int or ndarrayThe number of clusters to form as well as the number of centroids to generate. If
minitinitialization string is 'matrix', or if a ndarray is given instead, it is interpreted as initial cluster to use instead.iter: int, optionalNumber of iterations of the k-means algorithm to run. Note that this differs in meaning from the iters parameter to the kmeans function.
thresh: float, optional(not used yet)
minit: str, optionalMethod for initialization. Available methods are 'random', 'points', '++' and 'matrix':
'random': generate k centroids from a Gaussian with mean and variance estimated from the data.
'points': choose k observations (rows) at random from data for the initial centroids.
'++': choose k observations accordingly to the kmeans++ method (careful seeding)
'matrix': interpret the k parameter as a k by M (or length k array for 1-D data) array of initial centroids.
missing: str, optionalMethod to deal with empty clusters. Available methods are 'warn' and 'raise':
'warn': give a warning and continue.
'raise': raise an ClusterError and terminate the algorithm.
check_finite: bool, optionalWhether to check that the input matrices contain only finite numbers. Disabling may give a performance gain, but may result in problems (crashes, non-termination) if the inputs do contain infinities or NaNs. Default: True
rng: {None, int, `numpy.random.Generator`}, optionalIf
rngis passed by keyword, types other than numpy.random.Generator are passed to numpy.random.default_rng to instantiate aGenerator. Ifrngis already aGeneratorinstance, then the provided instance is used. Specifyrngfor repeatable function behavior.If this argument is passed by position or
seedis passed by keyword, legacy behavior for the argumentseedapplies:If
seedis None (or numpy.random), the numpy.random.RandomState singleton is used.If
seedis an int, a newRandomStateinstance is used, seeded withseed.If
seedis already aGeneratororRandomStateinstance then that instance is used.
Returns
centroid: ndarrayA 'k' by 'N' array of centroids found at the last iteration of k-means.
label: ndarraylabel[i] is the code or index of the centroid the ith observation is closest to.
Notes
Array API Standard Support
kmeans2 has experimental support for Python Array API Standard compatible backends in addition to NumPy. Please consider testing these features by setting an environment variable SCIPY_ARRAY_API=1 and providing CuPy, PyTorch, JAX, or Dask arrays as array arguments. The following combinations of backend and device (or other capability) are supported.
====================  ====================  ====================
Library               CPU                   GPU
====================  ====================  ====================
NumPy                 ✅                     n/a
CuPy                  n/a                   ⛔
PyTorch               ✅                     ⛔
JAX                   ⚠️ no JIT             ⛔
Dask                  ⚠️ computes graph     n/a
====================  ====================  ====================
See
dev-arrayapifor more information.
Examples
from scipy.cluster.vq import kmeans2
import matplotlib.pyplot as plt
import numpy as np
✓
rng = np.random.default_rng()
a = rng.multivariate_normal([0, 6], [[2, 1], [1, 1.5]], size=45)
b = rng.multivariate_normal([2, 0], [[1, -1], [-1, 3]], size=30)
c = rng.multivariate_normal([6, 4], [[5, 0], [0, 1.2]], size=25)
z = np.concatenate((a, b, c))
rng.shuffle(z)
✓
centroid, label = kmeans2(z, 3, minit='points')
✓centroid
✗counts = np.bincount(label)
✓counts
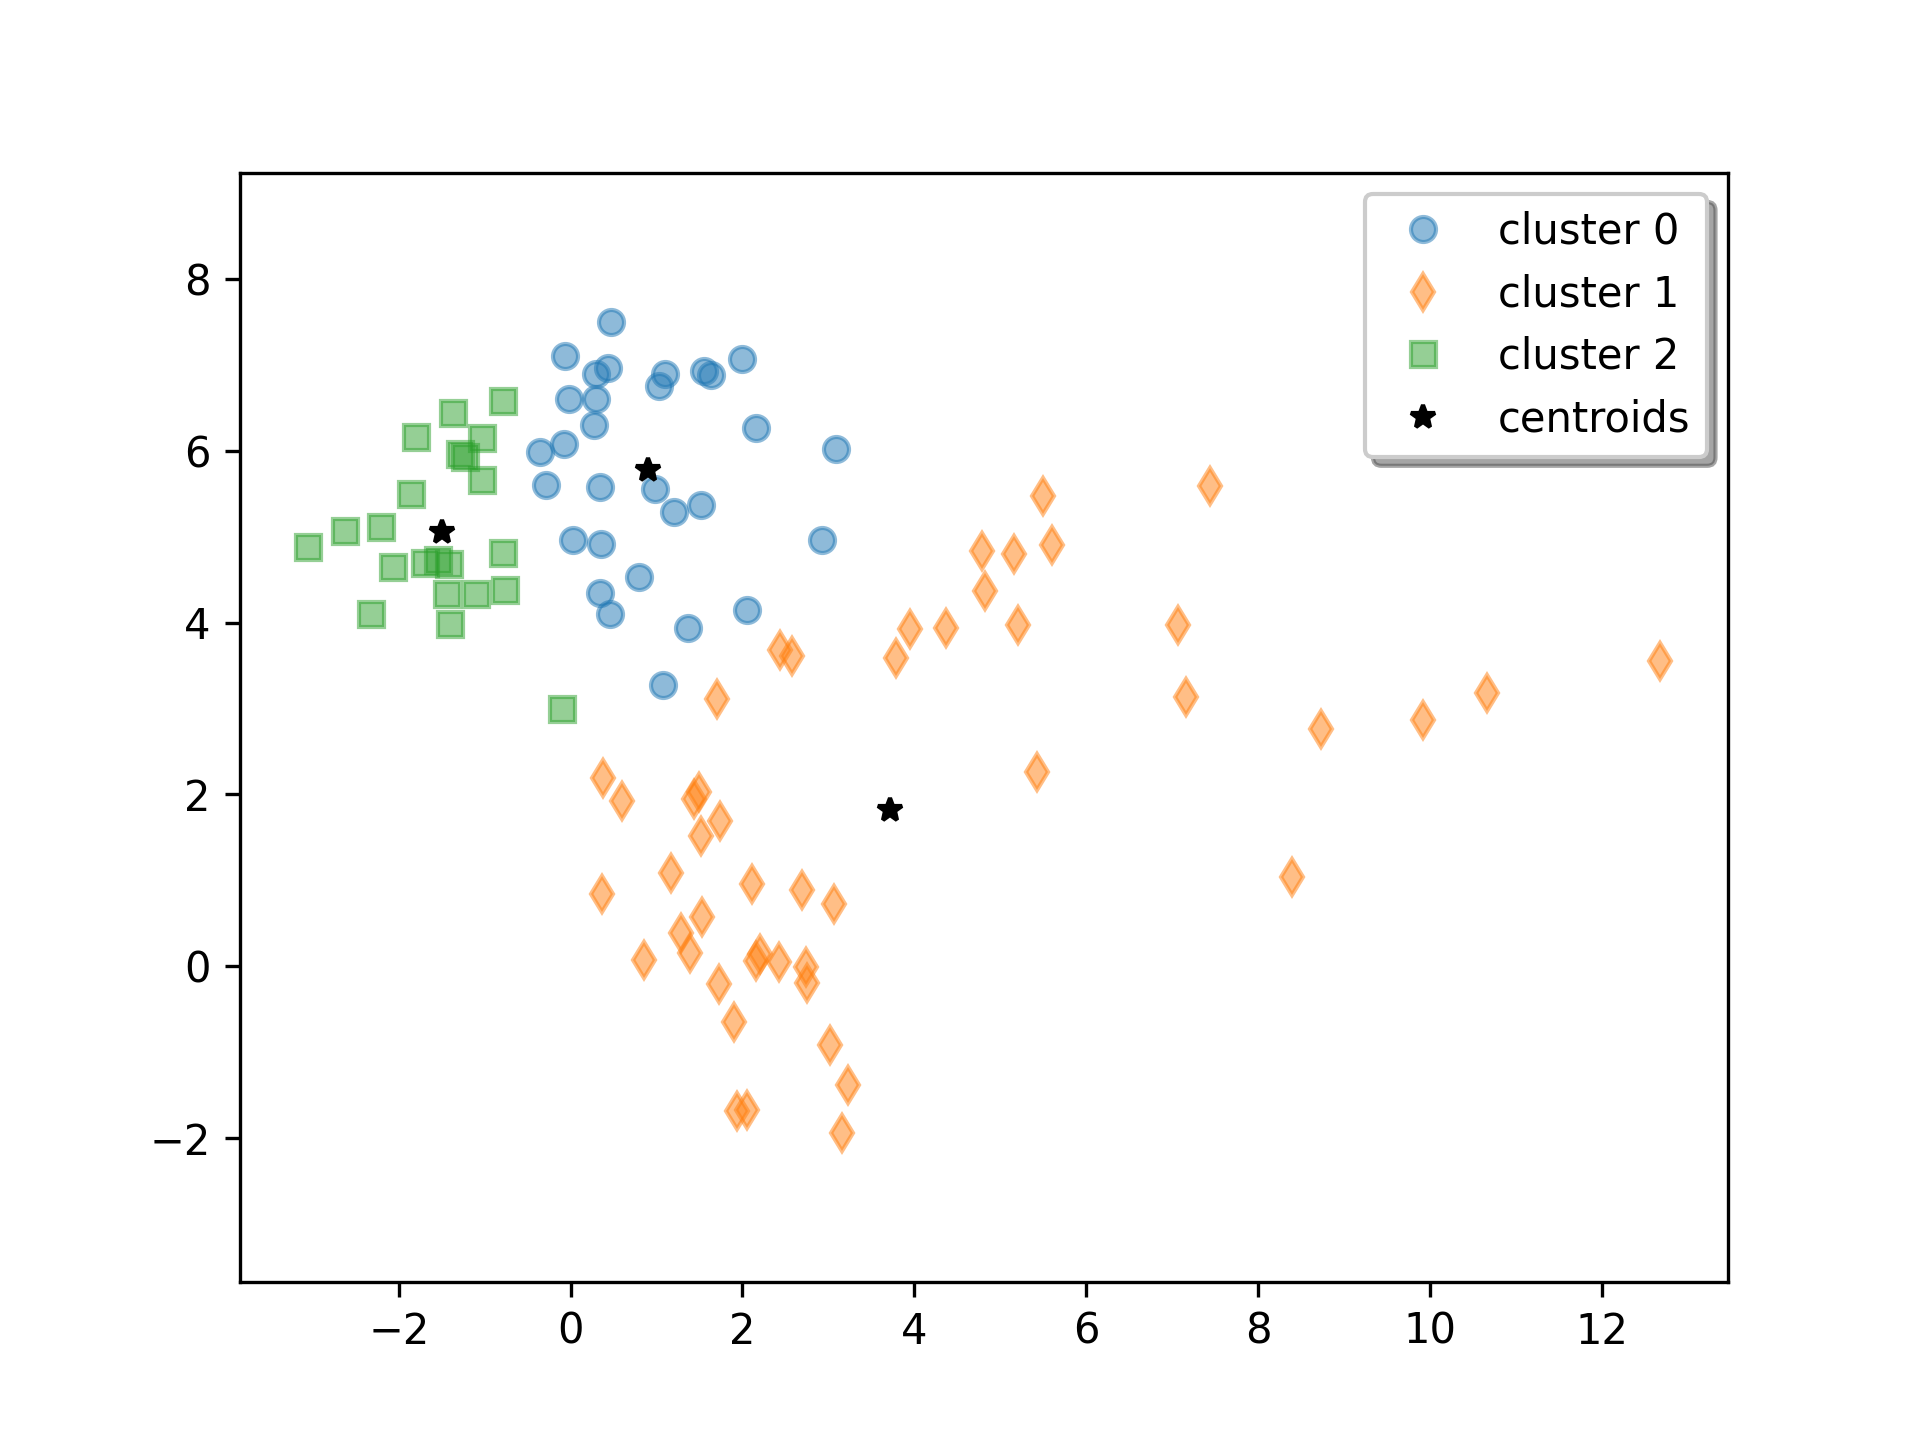
✗w0 = z[label == 0] w1 = z[label == 1] w2 = z[label == 2]✓
plt.plot(w0[:, 0], w0[:, 1], 'o', alpha=0.5, label='cluster 0')
plt.plot(w1[:, 0], w1[:, 1], 'd', alpha=0.5, label='cluster 1')
plt.plot(w2[:, 0], w2[:, 1], 's', alpha=0.5, label='cluster 2')
plt.plot(centroid[:, 0], centroid[:, 1], 'k*', label='centroids')
plt.axis('equal')
plt.legend(shadow=True)
✗
plt.show()
✓
See also
Aliases
-
scipy.cluster.vq.kmeans2