bundles / scipy latest / scipy / interpolate / _cubic / pchip_interpolate
function
scipy.interpolate._cubic:pchip_interpolate
Signature
def pchip_interpolate ( xi , yi , x , der = 0 , axis = 0 ) Summary
Convenience function for pchip interpolation.
Extended Summary
xi and yi are arrays of values used to approximate some function f, with yi = f(xi). The interpolant uses monotonic cubic splines to find the value of new points x and the derivatives there.
See scipy.interpolate.PchipInterpolator for details.
Parameters
xi: array_likeA sorted list of x-coordinates, of length N.
yi: array_likeA 1-D array of real values.
yi's length along the interpolation axis must be equal to the length ofxi. If N-D array, use axis parameter to select correct axis.x: scalar or array_likeOf length M.
der: int or list, optionalDerivatives to extract. The 0th derivative can be included to return the function value.
axis: int, optionalAxis in the yi array corresponding to the x-coordinate values.
Returns
y: scalar or array_likeThe result, of length R or length M or M by R.
Examples
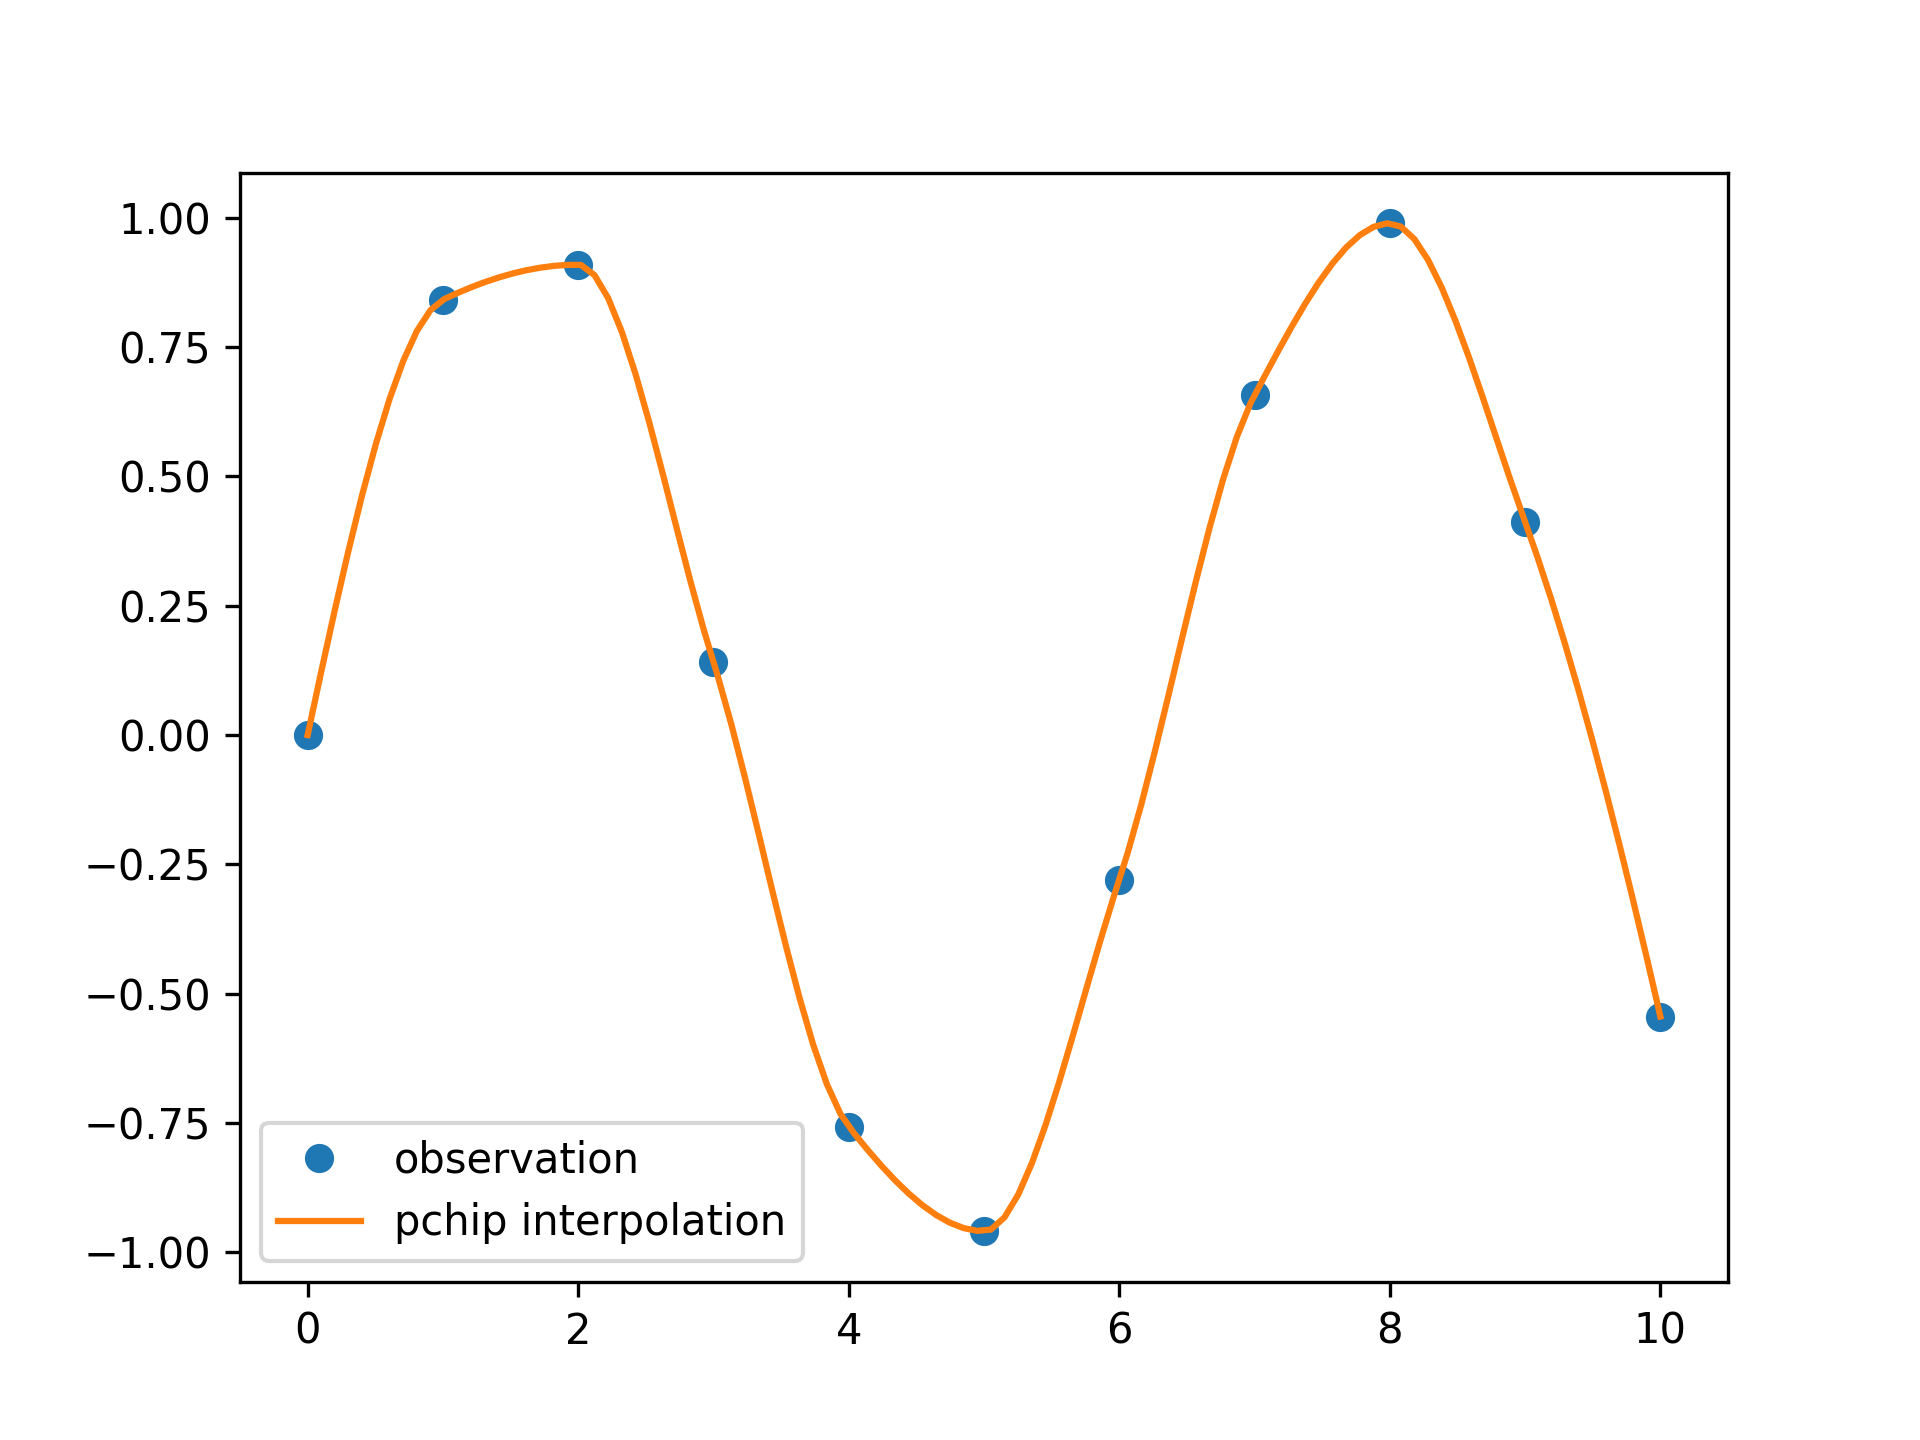
We can interpolate 2D observed data using pchip interpolation:import numpy as np import matplotlib.pyplot as plt from scipy.interpolate import pchip_interpolate x_observed = np.linspace(0.0, 10.0, 11) y_observed = np.sin(x_observed) x = np.linspace(min(x_observed), max(x_observed), num=100) y = pchip_interpolate(x_observed, y_observed, x)✓
plt.plot(x_observed, y_observed, "o", label="observation")
plt.plot(x, y, label="pchip interpolation")
plt.legend()
✗
plt.show()
✓
See also
- PchipInterpolator
PCHIP 1-D monotonic cubic interpolator.
Aliases
-
scipy.interpolate.pchip_interpolate