bundles / scipy latest / scipy / special / _basic / lqn
function
scipy.special._basic:lqn
source: build-install/usr/lib/python3.14/site-packages/scipy/special/_basic.py:2215
Signature
def lqn(n, z)Summary
Legendre functions of the second kind.
Extended Summary
Compute sequence of Legendre functions of the second kind, Qn(z) and derivatives for all degrees from 0 to n (inclusive). Returns two arrays of size (n+1,) + z.shape containing Qn(z) and Qn'(z).
Parameters
n: intMaximum degree of the Legendre functions.
z: array_like, complexReal or complex input values.
Returns
Qn_z: ndarray, shape (n+1,) + shape(z)Values for all degrees
0..nQn_d_z: ndarray, shape (n+1,) + shape(z)Derivatives for all degrees
0..n
Examples
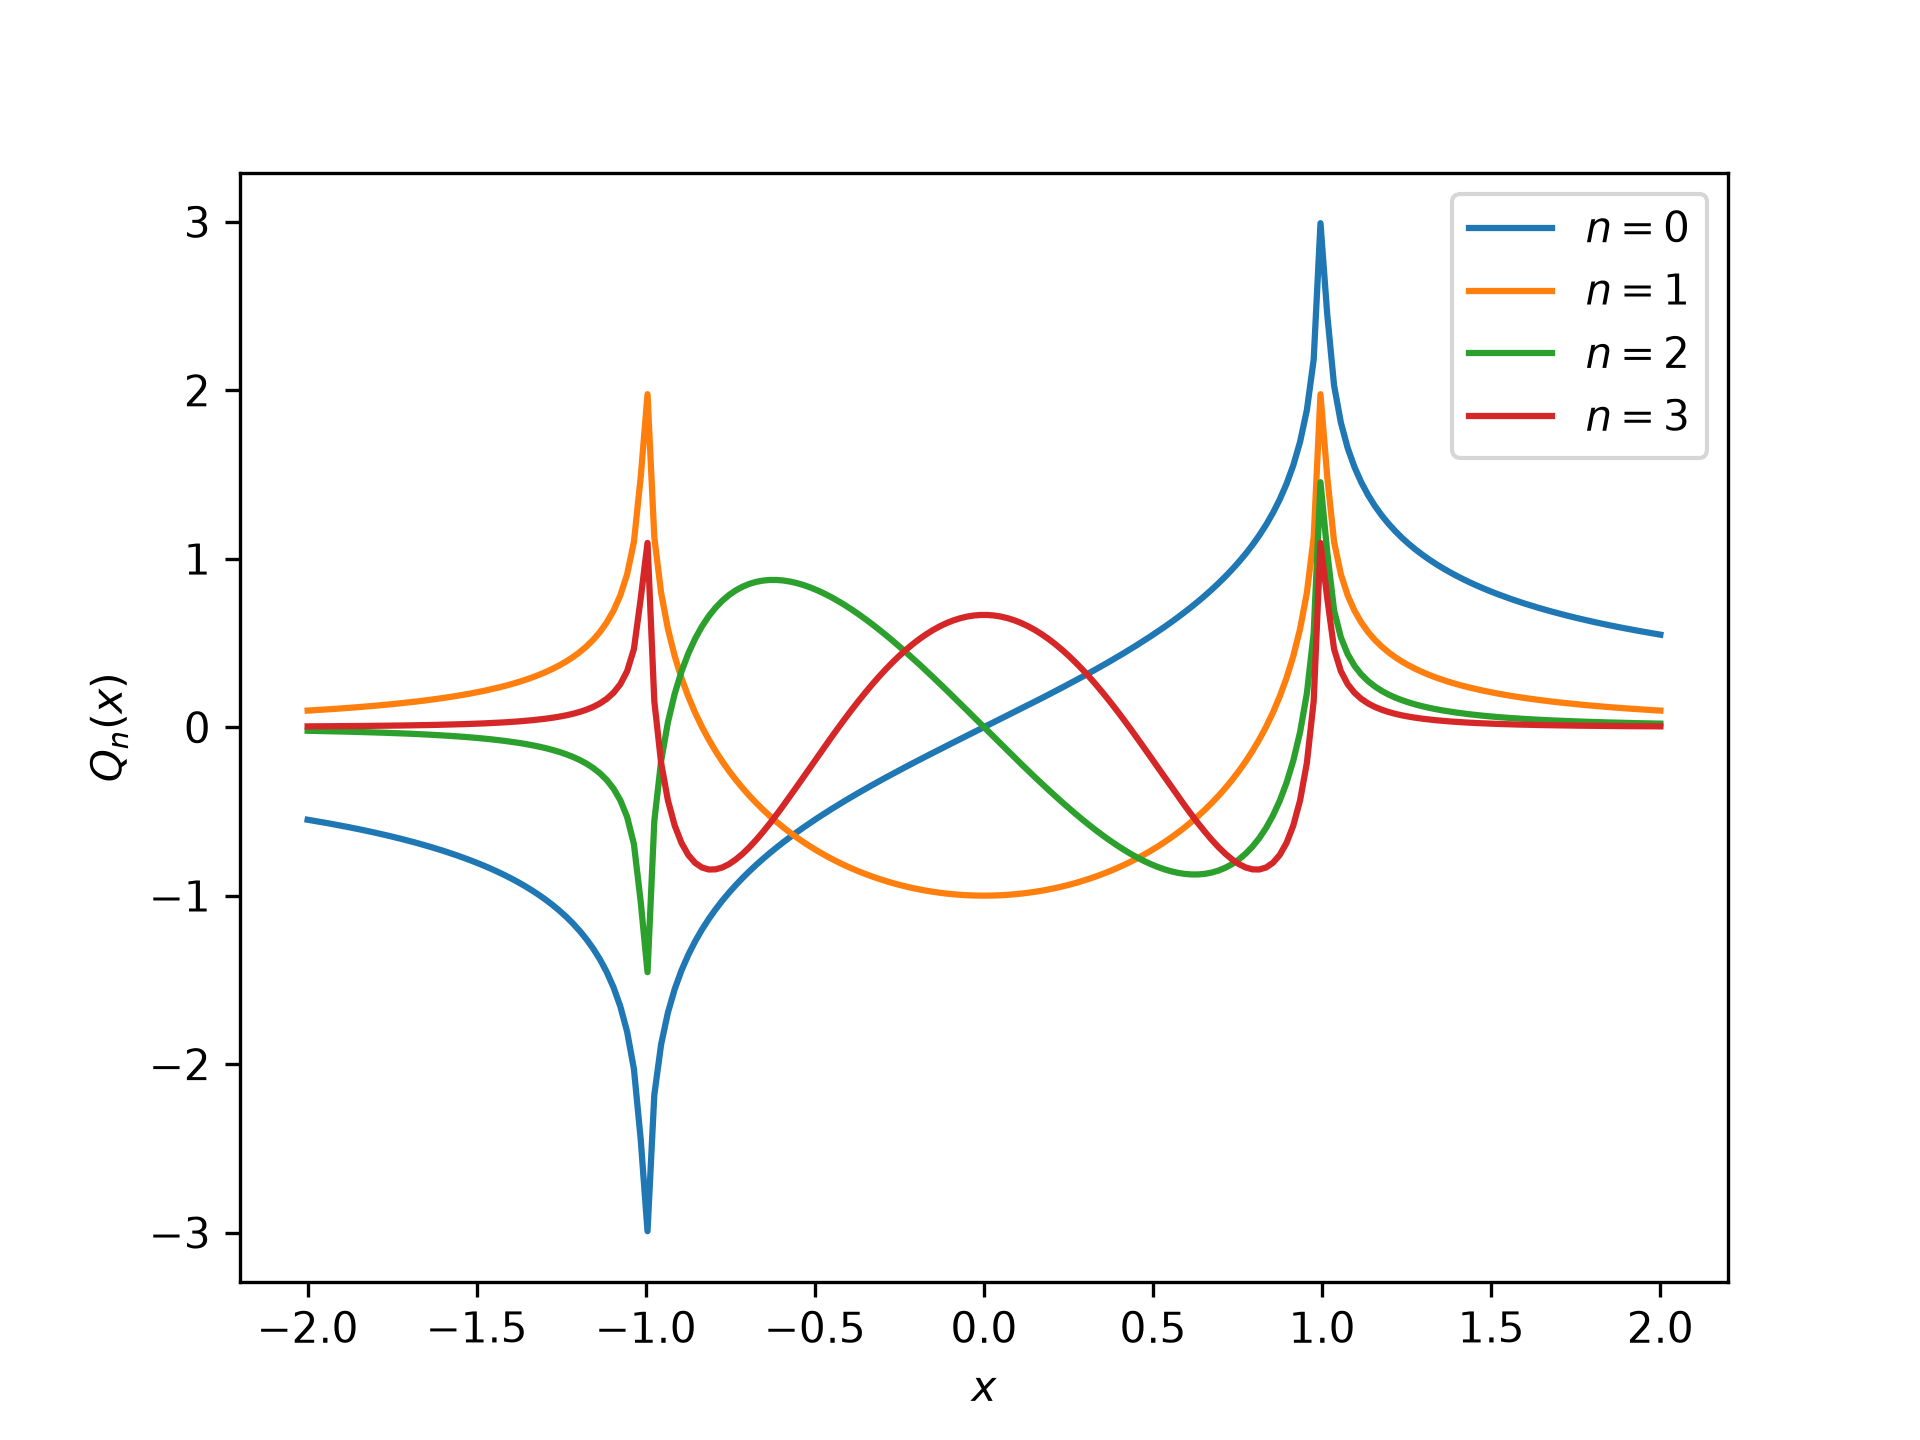
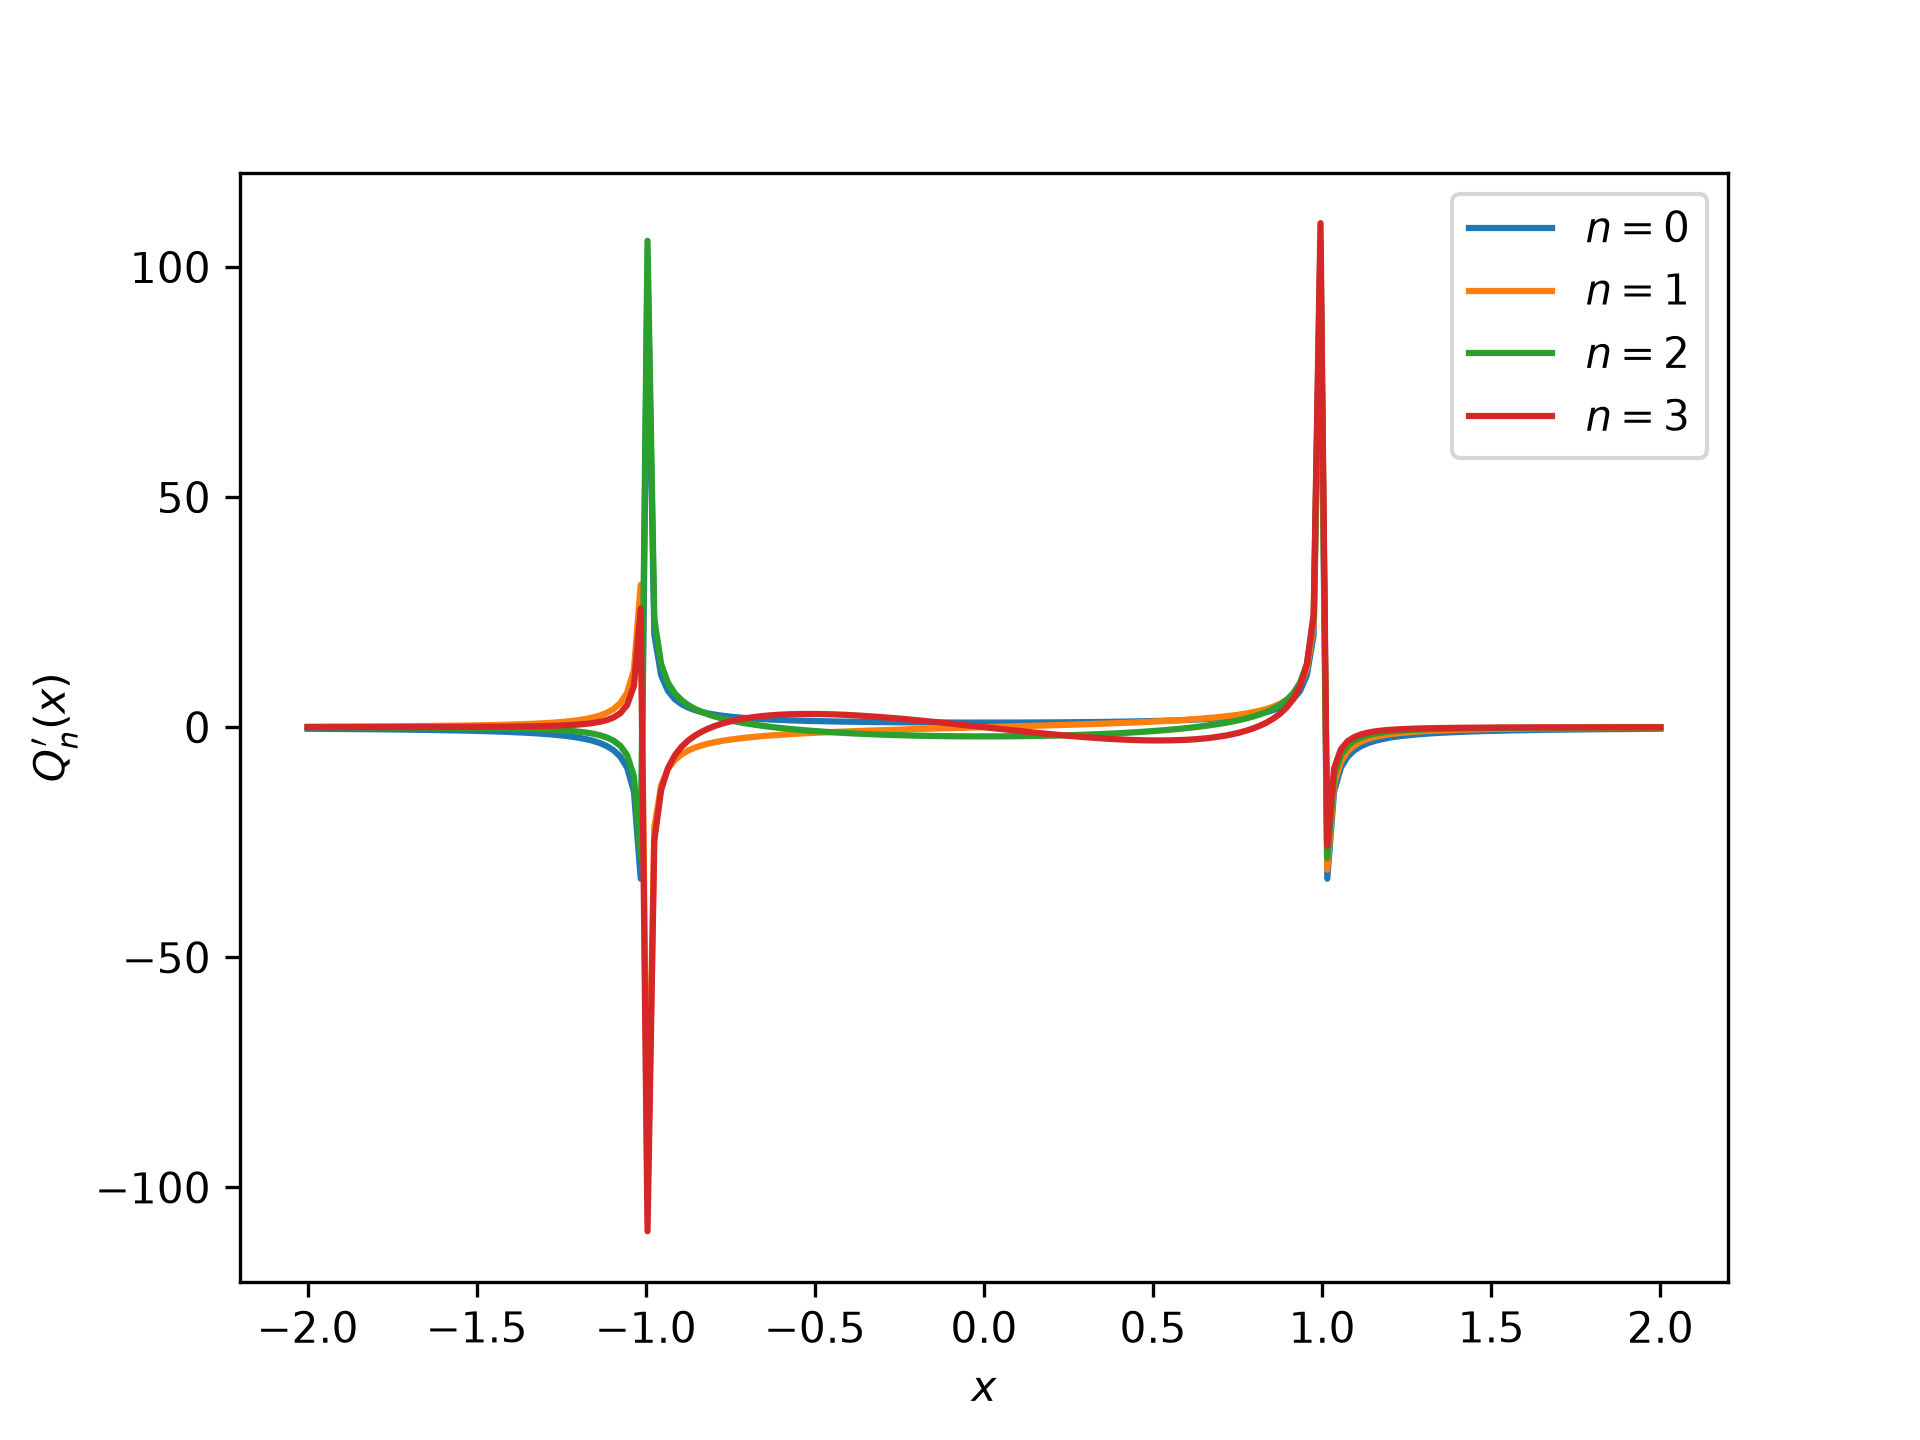
Compute :math:`Q_n(x)` and its derivatives on an interval.import numpy as np from scipy.special import lqn import matplotlib.pyplot as plt✓
xs = np.linspace(-2, 2, 200)
n_max = 3
Qn, dQn = lqn(n_max, xs)
✓
fig, ax = plt.subplots()
✓ax.plot(xs, Qn.T, "-") ax.set_xlabel(r"$x$") ax.set_ylabel(r"$Q_n(x)$") ax.legend([fr"$n={n}$" for n in range(n_max + 1)])✗
<matplotlib.legend.Legend object at 0x7f3f592f1940>
plt.show()
✓
fig, ax = plt.subplots()
✓ax.plot(xs, dQn.T, "-") ax.set_xlabel(r"$x$") ax.set_ylabel(r"$Q_n'(x)$") ax.legend([fr"$n={n}$" for n in range(n_max + 1)])✗
<matplotlib.legend.Legend object at 0x7f3f6854aa50>
plt.show()
✓
Aliases
scipy.special.lqn