bundles / scipy latest / scipy / stats / _discrete_distns / randint_gen
class
scipy.stats._discrete_distns:randint_gen
source: build-install/usr/lib/python3.14/site-packages/scipy/stats/_discrete_distns.py:1182
Signature
class randint_gen(a = 0, b = inf, name = None, badvalue = None, moment_tol = 1e-08, values = None, inc = 1, longname = None, shapes = None, seed = None)Members
Summary
A uniform discrete random variable.
Extended Summary
%(before_notes)s
Notes
The probability mass function for randint is:
for .
randint takes and as shape parameters.
%(after_notes)s
Examples
import numpy as np
from scipy.stats import randint
import matplotlib.pyplot as plt
fig, ax = plt.subplots(1, 1)
✓
low, high = 7, 31
mean, var, skew, kurt = randint.stats(low, high, moments='mvsk')
✓
x = np.arange(low - 5, high + 5)
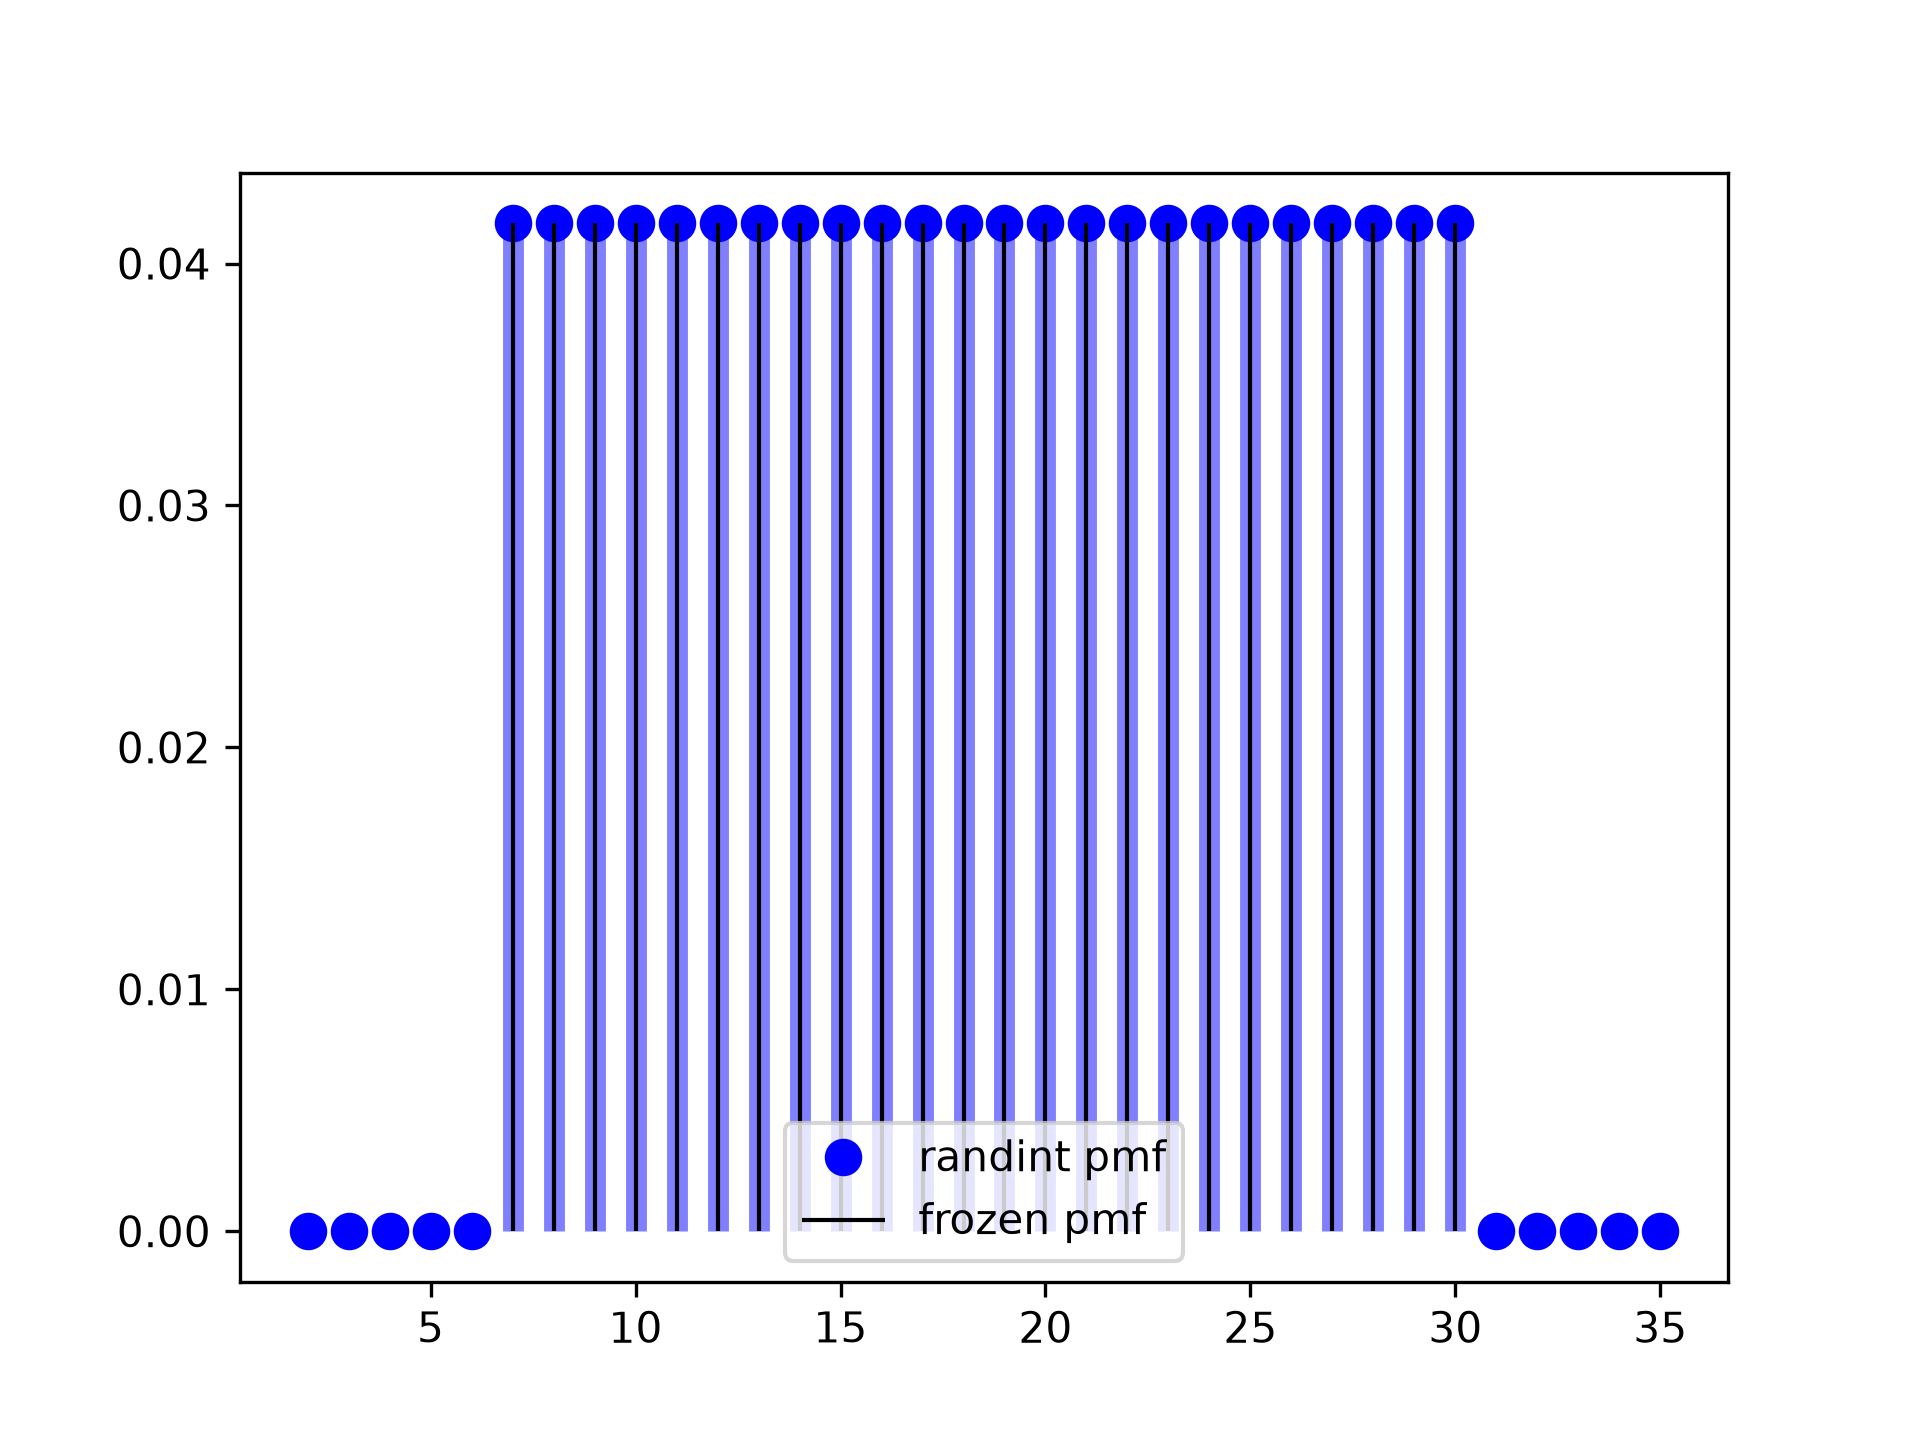
✓ax.plot(x, randint.pmf(x, low, high), 'bo', ms=8, label='randint pmf') ax.vlines(x, 0, randint.pmf(x, low, high), colors='b', lw=5, alpha=0.5)✗
<matplotlib.collections.LineCollection object at 0x7f3f59406850>Alternatively, the distribution object can be called (as a function) to fix the shape and location. This returns a "frozen" RV object holding the given parameters fixed. Freeze the distribution and display the frozen ``pmf``:
rv = randint(low, high)
✓ax.vlines(x, 0, rv.pmf(x), colors='k', linestyles='-', lw=1, label='frozen pmf') ax.legend(loc='lower center')✗
<matplotlib.legend.Legend object at 0x7f3f60796660>
plt.show()
✓
q = np.arange(low, high)
p = randint.cdf(q, low, high)
np.allclose(q, randint.ppf(p, low, high))
✓
TrueGenerate random numbers:
r = randint.rvs(low, high, size=1000)
✓Aliases
scipy.stats._discrete_distns.randint_gen