bundles / scipy latest / scipy / stats / _hypotests / tukey_hsd
function
scipy.stats._hypotests:tukey_hsd
source: /scipy/stats/_hypotests.py :1949
Signature
def tukey_hsd ( * args , equal_var = True ) Summary
Perform Tukey's HSD test for equality of means over multiple treatments.
Extended Summary
Tukey's honestly significant difference (HSD) test performs pairwise comparison of means for a set of samples. Whereas ANOVA (e.g. f_oneway) assesses whether the true means underlying each sample are identical, Tukey's HSD is a post hoc test used to compare the mean of each sample to the mean of each other sample.
The null hypothesis is that the distributions underlying the samples all have the same mean. The test statistic, which is computed for every possible pairing of samples, is simply the difference between the sample means. For each pair, the p-value is the probability under the null hypothesis (and other assumptions; see notes) of observing such an extreme value of the statistic, considering that many pairwise comparisons are being performed. Confidence intervals for the difference between each pair of means are also available.
Parameters
sample1, sample2, ...: array_likeThe sample measurements for each group. There must be at least two arguments.
equal_var: bool, optionalIf True (default) and equal sample size, perform Tukey-HSD test [6]. If True and unequal sample size, perform Tukey-Kramer test [4]. If False, perform Games-Howell test [7], which does not assume equal variances.
Returns
result: `~scipy.stats._result_classes.TukeyHSDResult` instanceThe return value is an object with the following attributes:
statistic
statistic
pvalue
pvalue
The object has the following methods:
confidence_interval(confidence_level=0.95):
Compute the confidence interval for the specified confidence level.
Notes
The use of this test relies on several assumptions.
The observations are independent within and among groups.
The observations within each group are normally distributed.
The distributions from which the samples are drawn have the same finite variance.
The original formulation of the test was for samples of equal size drawn from populations assumed to have equal variances [6]. In case of unequal sample sizes, the test uses the Tukey-Kramer method [4]. When equal variances are not assumed (equal_var=False), the test uses the Games-Howell method [7].
Array API Standard Support
tukey_hsd has experimental support for Python Array API Standard compatible backends in addition to NumPy. Please consider testing these features by setting an environment variable SCIPY_ARRAY_API=1 and providing CuPy, PyTorch, JAX, or Dask arrays as array arguments. The following combinations of backend and device (or other capability) are supported.
====================  ====================  ====================
Library               CPU                   GPU
====================  ====================  ====================
NumPy                 ✅                     n/a
CuPy                  n/a                   ⛔
PyTorch               ⛔                     ⛔
JAX                   ⛔                     ⛔
Dask                  ⛔                     n/a
====================  ====================  ====================
See
dev-arrayapifor more information.
Examples
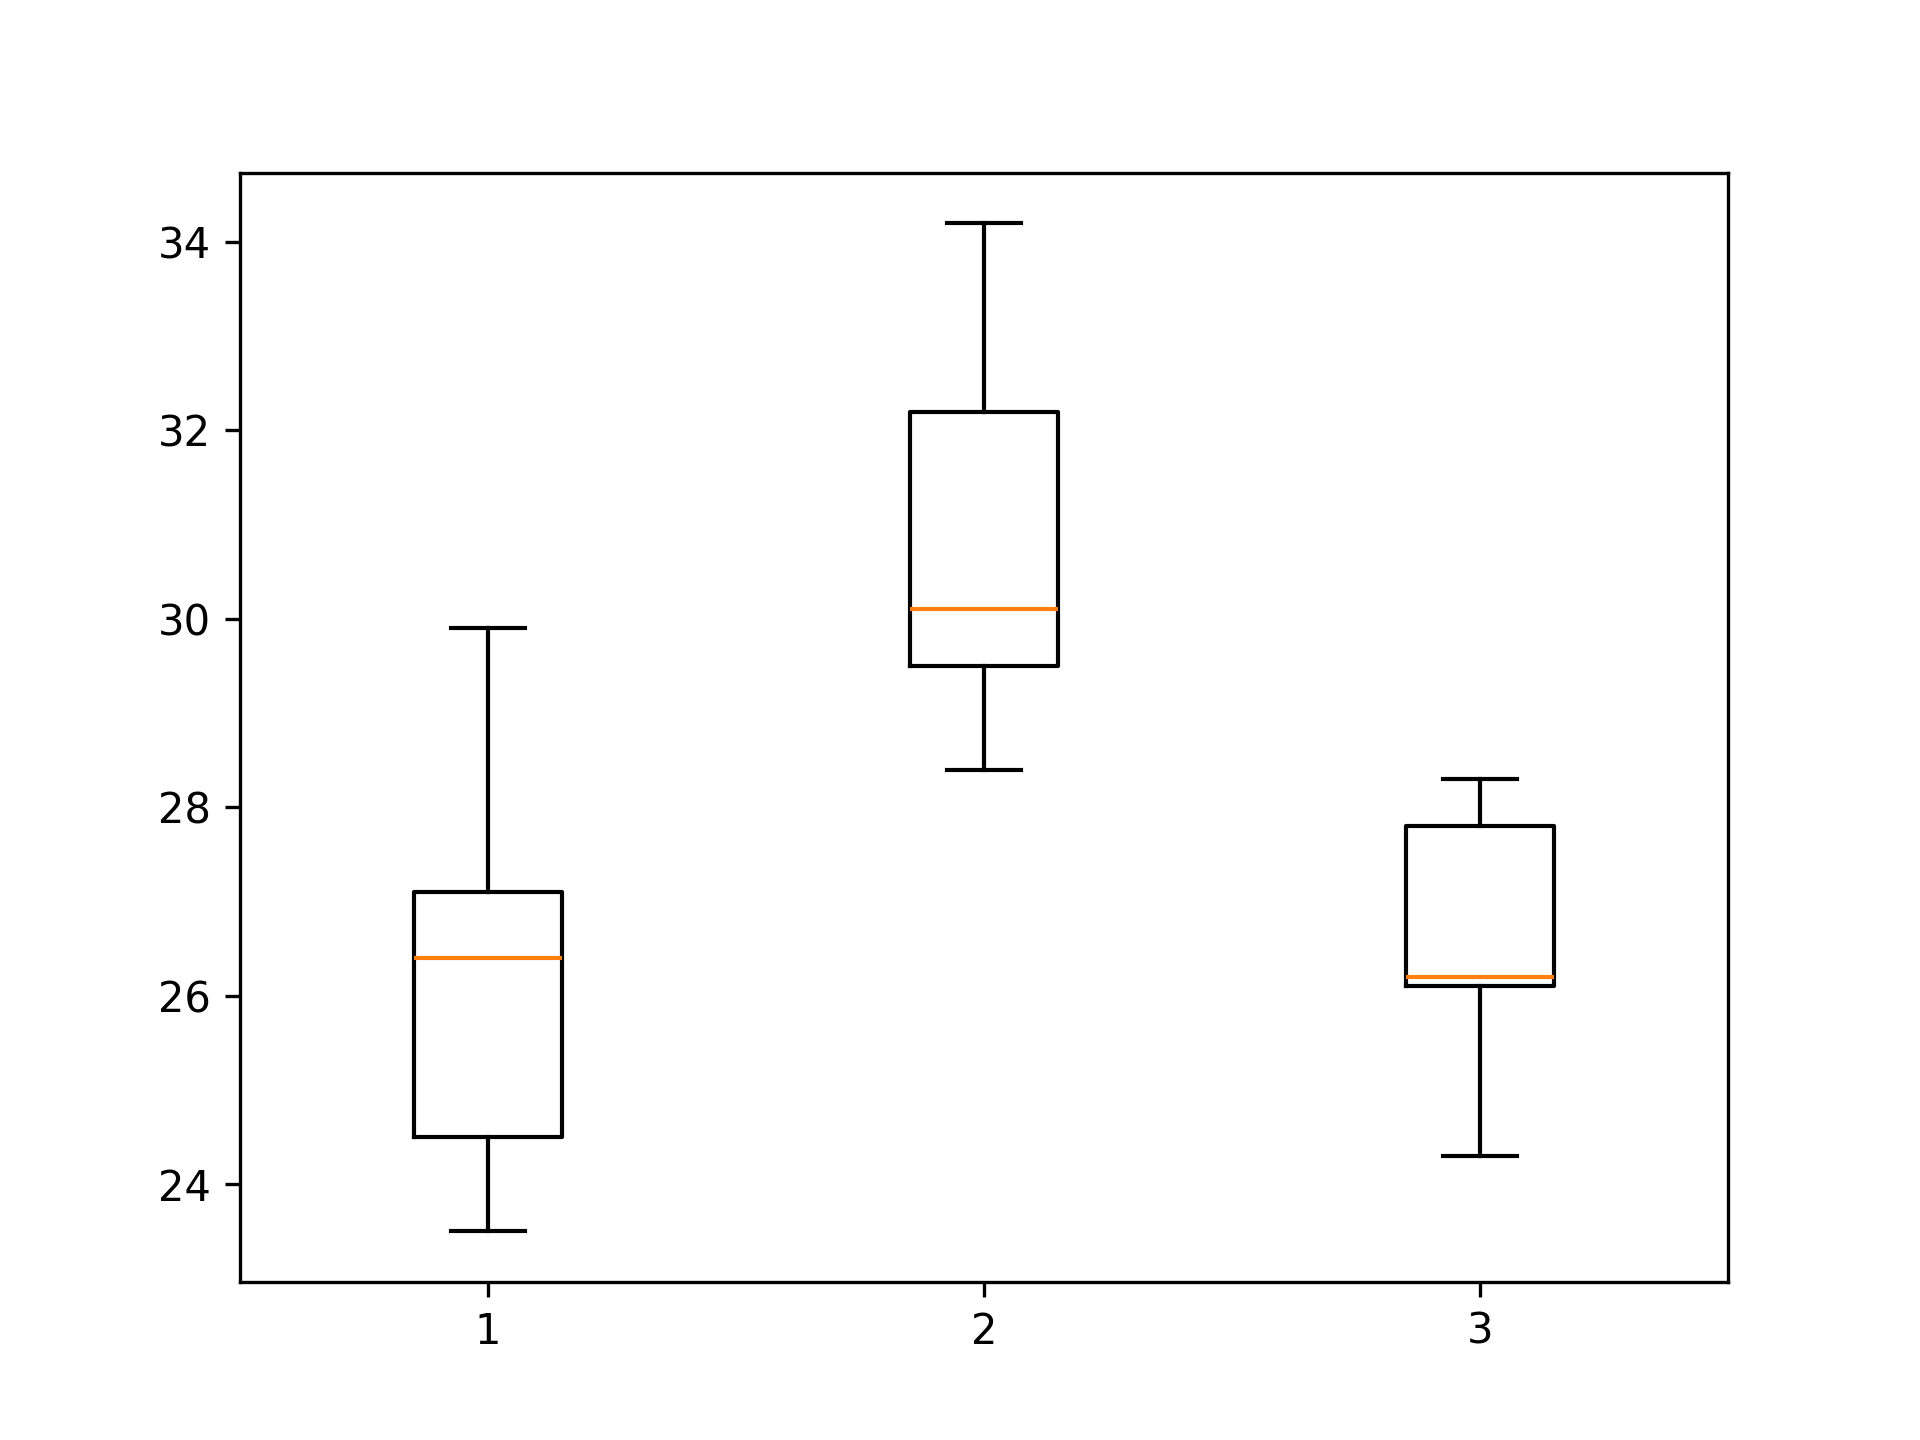
Here are some data comparing the time to relief of three brands of headache medicine, reported in minutes. Data adapted from [3]_.import numpy as np from scipy.stats import tukey_hsd group0 = [24.5, 23.5, 26.4, 27.1, 29.9] group1 = [28.4, 34.2, 29.5, 32.2, 30.1] group2 = [26.1, 28.3, 24.3, 26.2, 27.8]✓
import matplotlib.pyplot as plt
fig, ax = plt.subplots(1, 1)
✓
ax.boxplot([group0, group1, group2])
✗plt.show()
✓
res = tukey_hsd(group0, group1, group2)
✓print(res)
✗group0 = [24.5, 23.5, 26.4, 27.1, 29.9] group1 = [28.4, 34.2, 29.5, 32.2, 30.1] group2 = [26.1, 28.3, 24.3, 26.2, 27.8] result = tukey_hsd(group0, group1, group2) conf = res.confidence_interval(confidence_level=.99) for ((i, j), l) in np.ndenumerate(conf.low): # filter out self comparisons if i != j: h = conf.high[i,j] print(f"({i} - {j}) {l:>6.3f} {h:>6.3f}")✓
See also
- dunnett
performs comparison of means against a control group.
Aliases
-
scipy.stats.tukey_hsd