bundles / scipy latest / scipy / stats / _stats_mstats_common / theilslopes
function
scipy.stats._stats_mstats_common:theilslopes
Signature
def theilslopes ( y , x = None , alpha = 0.95 , method = separate , * , axis = None , nan_policy = propagate , keepdims = False ) Summary
Computes the Theil-Sen estimator for a set of points (x, y).
Extended Summary
theilslopes implements a method for robust linear regression. It computes the slope as the median of all slopes between paired values.
Parameters
y: array_likeDependent variable.
x: array_like or None, optionalIndependent variable. If None, use
arange(len(y))instead.alpha: float, optionalConfidence degree between 0 and 1. Default is 95% confidence. Note that
alphais symmetric around 0.5, i.e. both 0.1 and 0.9 are interpreted as "find the 90% confidence interval".method: {'joint', 'separate'}, optionalMethod to be used for computing estimate for intercept. Following methods are supported,
'joint': Uses np.median(y - slope * x) as intercept.
'separate': Uses np.median(y) - slope * np.median(x)
as intercept.
The default is 'separate'.
axis: int or None, default: NoneIf an int, the axis of the input along which to compute the statistic. The statistic of each axis-slice (e.g. row) of the input will appear in a corresponding element of the output. If
None, the input will be raveled before computing the statistic.nan_policy: {'propagate', 'omit', 'raise'}Defines how to handle input NaNs.
propagate: if a NaN is present in the axis slice (e.g. row) along which the statistic is computed, the corresponding entry of the output will be NaN.omit: NaNs will be omitted when performing the calculation. If insufficient data remains in the axis slice along which the statistic is computed, the corresponding entry of the output will be NaN.raise: if a NaN is present, aValueErrorwill be raised.
keepdims: bool, default: FalseIf this is set to True, the axes which are reduced are left in the result as dimensions with size one. With this option, the result will broadcast correctly against the input array.
Returns
result: ``TheilslopesResult`` instanceThe return value is an object with the following attributes:
slope
slope
intercept
intercept
low_slope
low_slope
high_slope
high_slope
Notes
The implementation of theilslopes follows [1]. The intercept is not defined in [1], and here it is defined as median(y) - slope*median(x), which is given in [3]. Other definitions of the intercept exist in the literature such as median(y - slope*x) in [4]. The approach to compute the intercept can be determined by the parameter method. A confidence interval for the intercept is not given as this question is not addressed in [1].
For compatibility with older versions of SciPy, the return value acts like a namedtuple of length 4, with fields slope, intercept, low_slope, and high_slope, so one can continue to write
slope, intercept, low_slope, high_slope = theilslopes(y, x)Beginning in SciPy 1.9, np.matrix inputs (not recommended for new code) are converted to np.ndarray before the calculation is performed. In this case, the output will be a scalar or np.ndarray of appropriate shape rather than a 2D np.matrix. Similarly, while masked elements of masked arrays are ignored, the output will be a scalar or np.ndarray rather than a masked array with mask=False.
Array API Standard Support
theilslopes has experimental support for Python Array API Standard compatible backends in addition to NumPy. Please consider testing these features by setting an environment variable SCIPY_ARRAY_API=1 and providing CuPy, PyTorch, JAX, or Dask arrays as array arguments. The following combinations of backend and device (or other capability) are supported.
====================  ====================  ====================
Library               CPU                   GPU
====================  ====================  ====================
NumPy                 ✅                     n/a
CuPy                  n/a                   ⛔
PyTorch               ⛔                     ⛔
JAX                   ⛔                     ⛔
Dask                  ⛔                     n/a
====================  ====================  ====================
See
dev-arrayapifor more information.
Examples
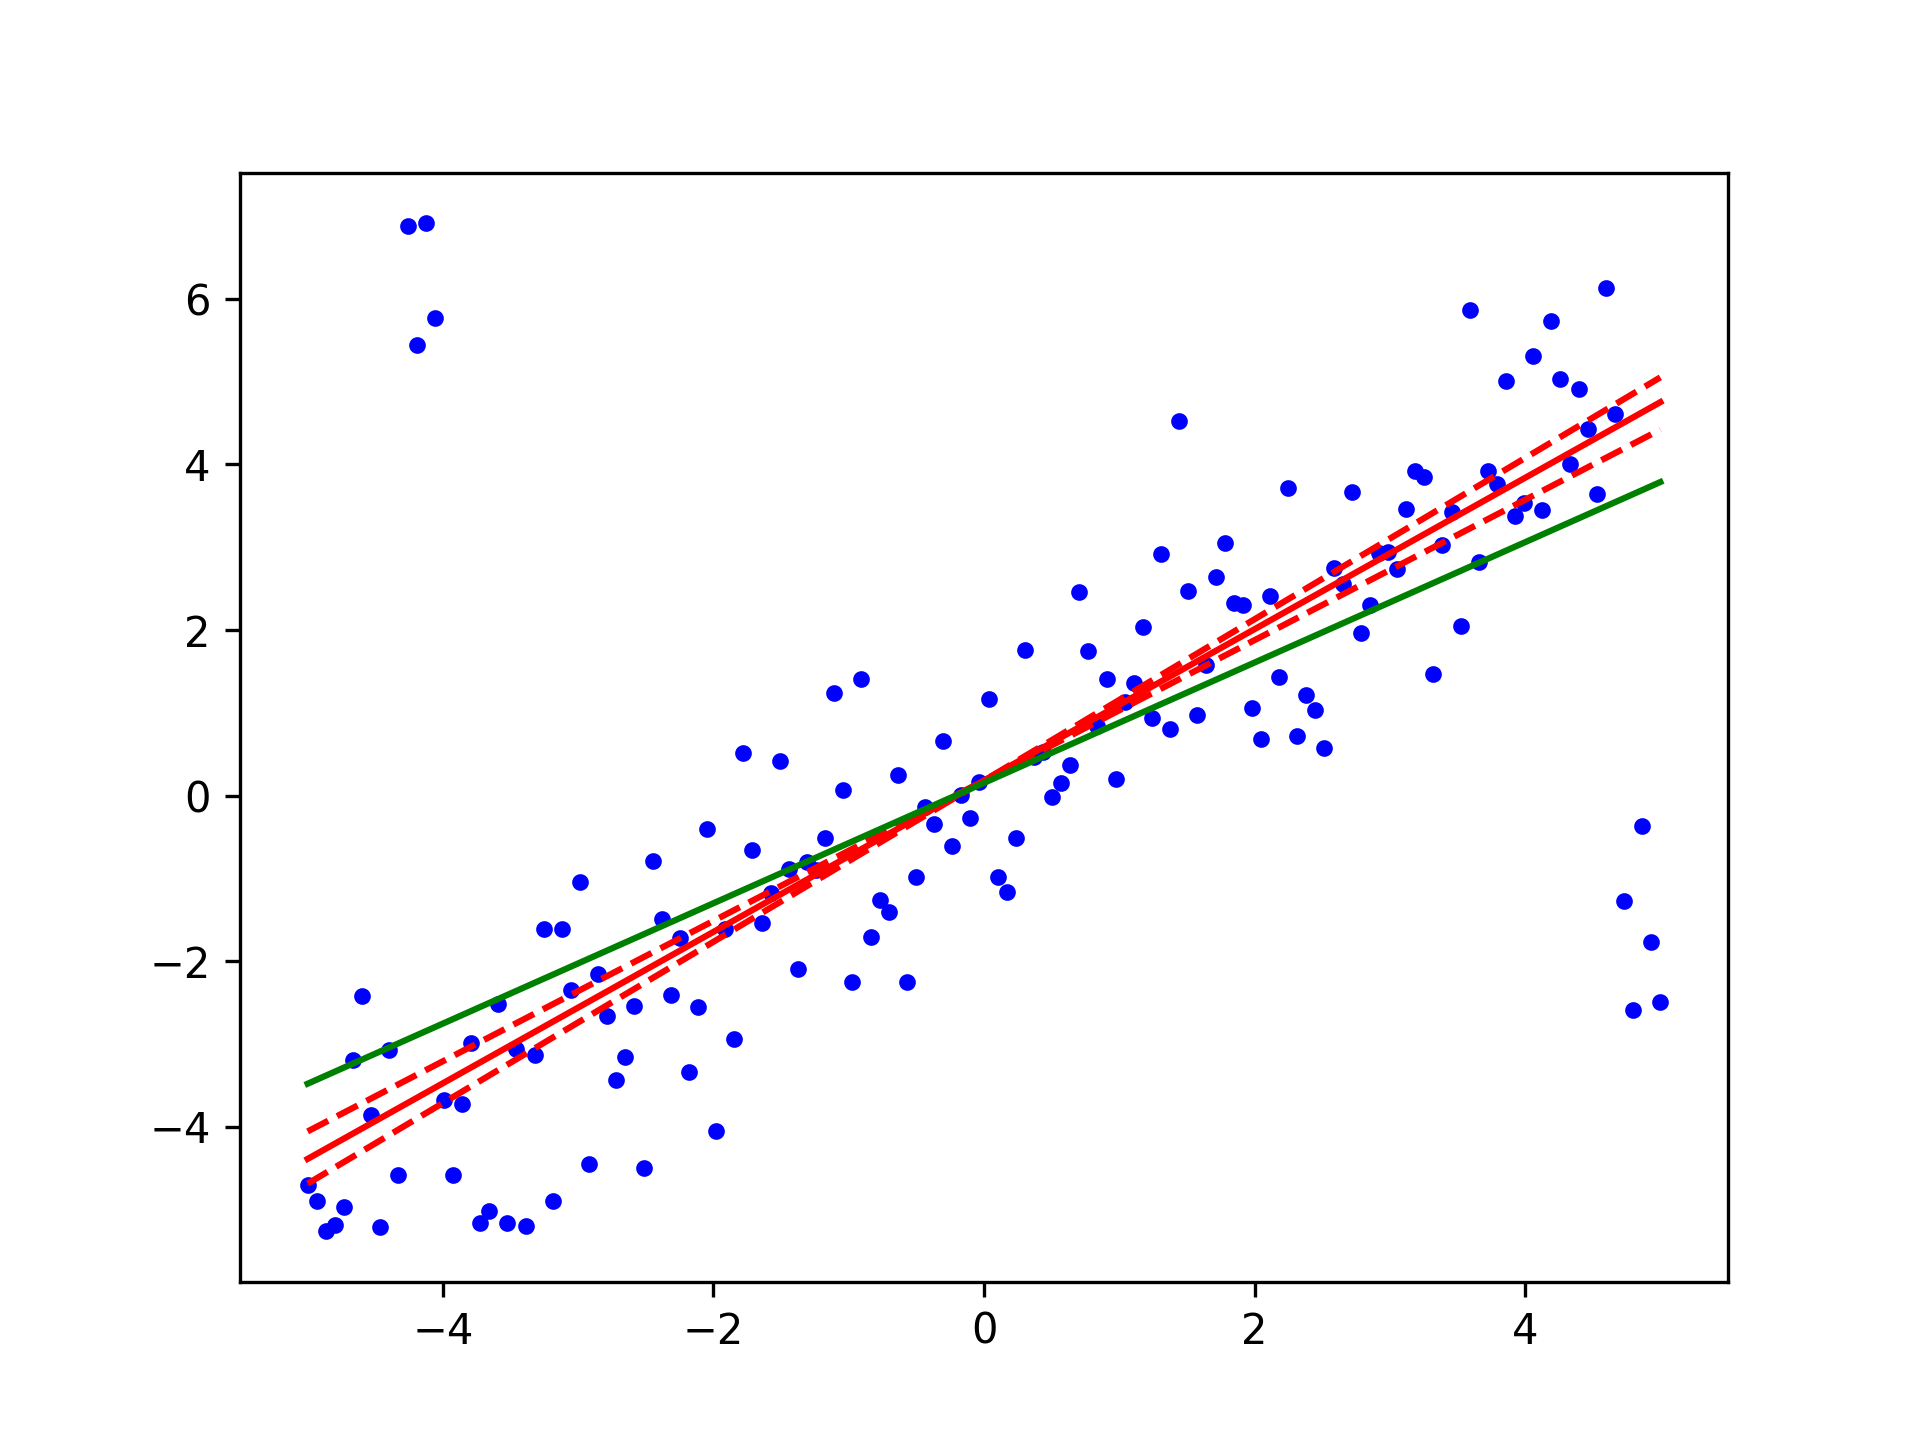
import numpy as np
from scipy import stats
import matplotlib.pyplot as plt
✓
x = np.linspace(-5, 5, num=150)
y = x + np.random.normal(size=x.size)
y[11:15] += 10  # add outliers
y[-5:] -= 7
✓
res = stats.theilslopes(y, x, 0.90, method='separate')
lsq_res = stats.linregress(x, y)
✓
fig = plt.figure()
ax = fig.add_subplot(111)
✓
ax.plot(x, y, 'b.')
ax.plot(x, res[1] + res[0] * x, 'r-')
ax.plot(x, res[1] + res[2] * x, 'r--')
ax.plot(x, res[1] + res[3] * x, 'r--')
ax.plot(x, lsq_res[1] + lsq_res[0] * x, 'g-')
✗
plt.show()
✓
See also
- siegelslopes
a similar technique using repeated medians
Aliases
-
scipy.stats.theilslopes