bundles / scipy 1.17.1 / scipy / signal / _spectral_py / periodogram
function
scipy.signal._spectral_py:periodogram
Signature
def periodogram ( x , fs = 1.0 , window = boxcar , nfft = None , detrend = constant , return_onesided = True , scaling = density , axis = -1 ) Summary
Estimate power spectral density using a periodogram.
Parameters
x: array_likeTime series of measurement values
fs: float, optionalSampling frequency of the
xtime series. Defaults to 1.0.window: str or tuple or array_like, optionalDesired window to use. If
windowis a string or tuple, it is passed to get_window to generate the window values, which are DFT-even by default. See get_window for a list of windows and required parameters. Ifwindowis array_like it will be used directly as the window and its length must be equal to the length of the axis over which the periodogram is computed. Defaults to 'boxcar'.nfft: int, optionalLength of the FFT used. If
Nonethe length ofxwill be used.detrend: str or function or `False`, optionalSpecifies how to detrend each segment. If
detrendis a string, it is passed as thetypeargument to thedetrendfunction. If it is a function, it takes a segment and returns a detrended segment. IfdetrendisFalse, no detrending is done. Defaults to 'constant'.return_onesided: bool, optionalIf
True, return a one-sided spectrum for real data. IfFalsereturn a two-sided spectrum. Defaults toTrue, but for complex data, a two-sided spectrum is always returned.scaling: { 'density', 'spectrum' }, optionalSelects between computing the power spectral density ('density') where Pxx has units of V²/Hz and computing the squared magnitude spectrum ('spectrum') where Pxx has units of V², if
xis measured in V andfsis measured in Hz. Defaults to 'density'axis: int, optionalAxis along which the periodogram is computed; the default is over the last axis (i.e.
axis=-1).
Returns
f: ndarrayArray of sample frequencies.
Pxx: ndarrayPower spectral density or power spectrum of
x.
Notes
The ratio of the squared magnitude (scaling='spectrum') divided by the spectral power density (scaling='density') is the constant factor of sum(abs(window)**2)*fs / abs(sum(window))**2. If return_onesided is True, the values of the negative frequencies are added to values of the corresponding positive ones.
Consult the tutorial_SpectralAnalysis section of the user_guide for a discussion of the scalings of the power spectral density and the magnitude (squared) spectrum.
Array API Standard Support
periodogram has experimental support for Python Array API Standard compatible backends in addition to NumPy. Please consider testing these features by setting an environment variable SCIPY_ARRAY_API=1 and providing CuPy, PyTorch, JAX, or Dask arrays as array arguments. The following combinations of backend and device (or other capability) are supported.
====================  ====================  ====================
Library               CPU                   GPU
====================  ====================  ====================
NumPy                 ✅                     n/a
CuPy                  n/a                   ⛔
PyTorch               ⛔                     ⛔
JAX                   ⛔                     ⛔
Dask                  ⛔                     n/a
====================  ====================  ====================
See
dev-arrayapifor more information.
Examples
import numpy as np
from scipy import signal
import matplotlib.pyplot as plt
rng = np.random.default_rng()
✓
fs = 10e3
N = 1e5
amp = 2*np.sqrt(2)
freq = 1234.0
noise_power = 0.001 * fs / 2
time = np.arange(N) / fs
x = amp*np.sin(2*np.pi*freq*time)
x += rng.normal(scale=np.sqrt(noise_power), size=time.shape)
✓
f, Pxx_den = signal.periodogram(x, fs)
✓plt.semilogy(f, Pxx_den) plt.ylim([1e-7, 1e2]) plt.xlabel('frequency [Hz]') plt.ylabel('PSD [V**2/Hz]')✗
plt.show()
✓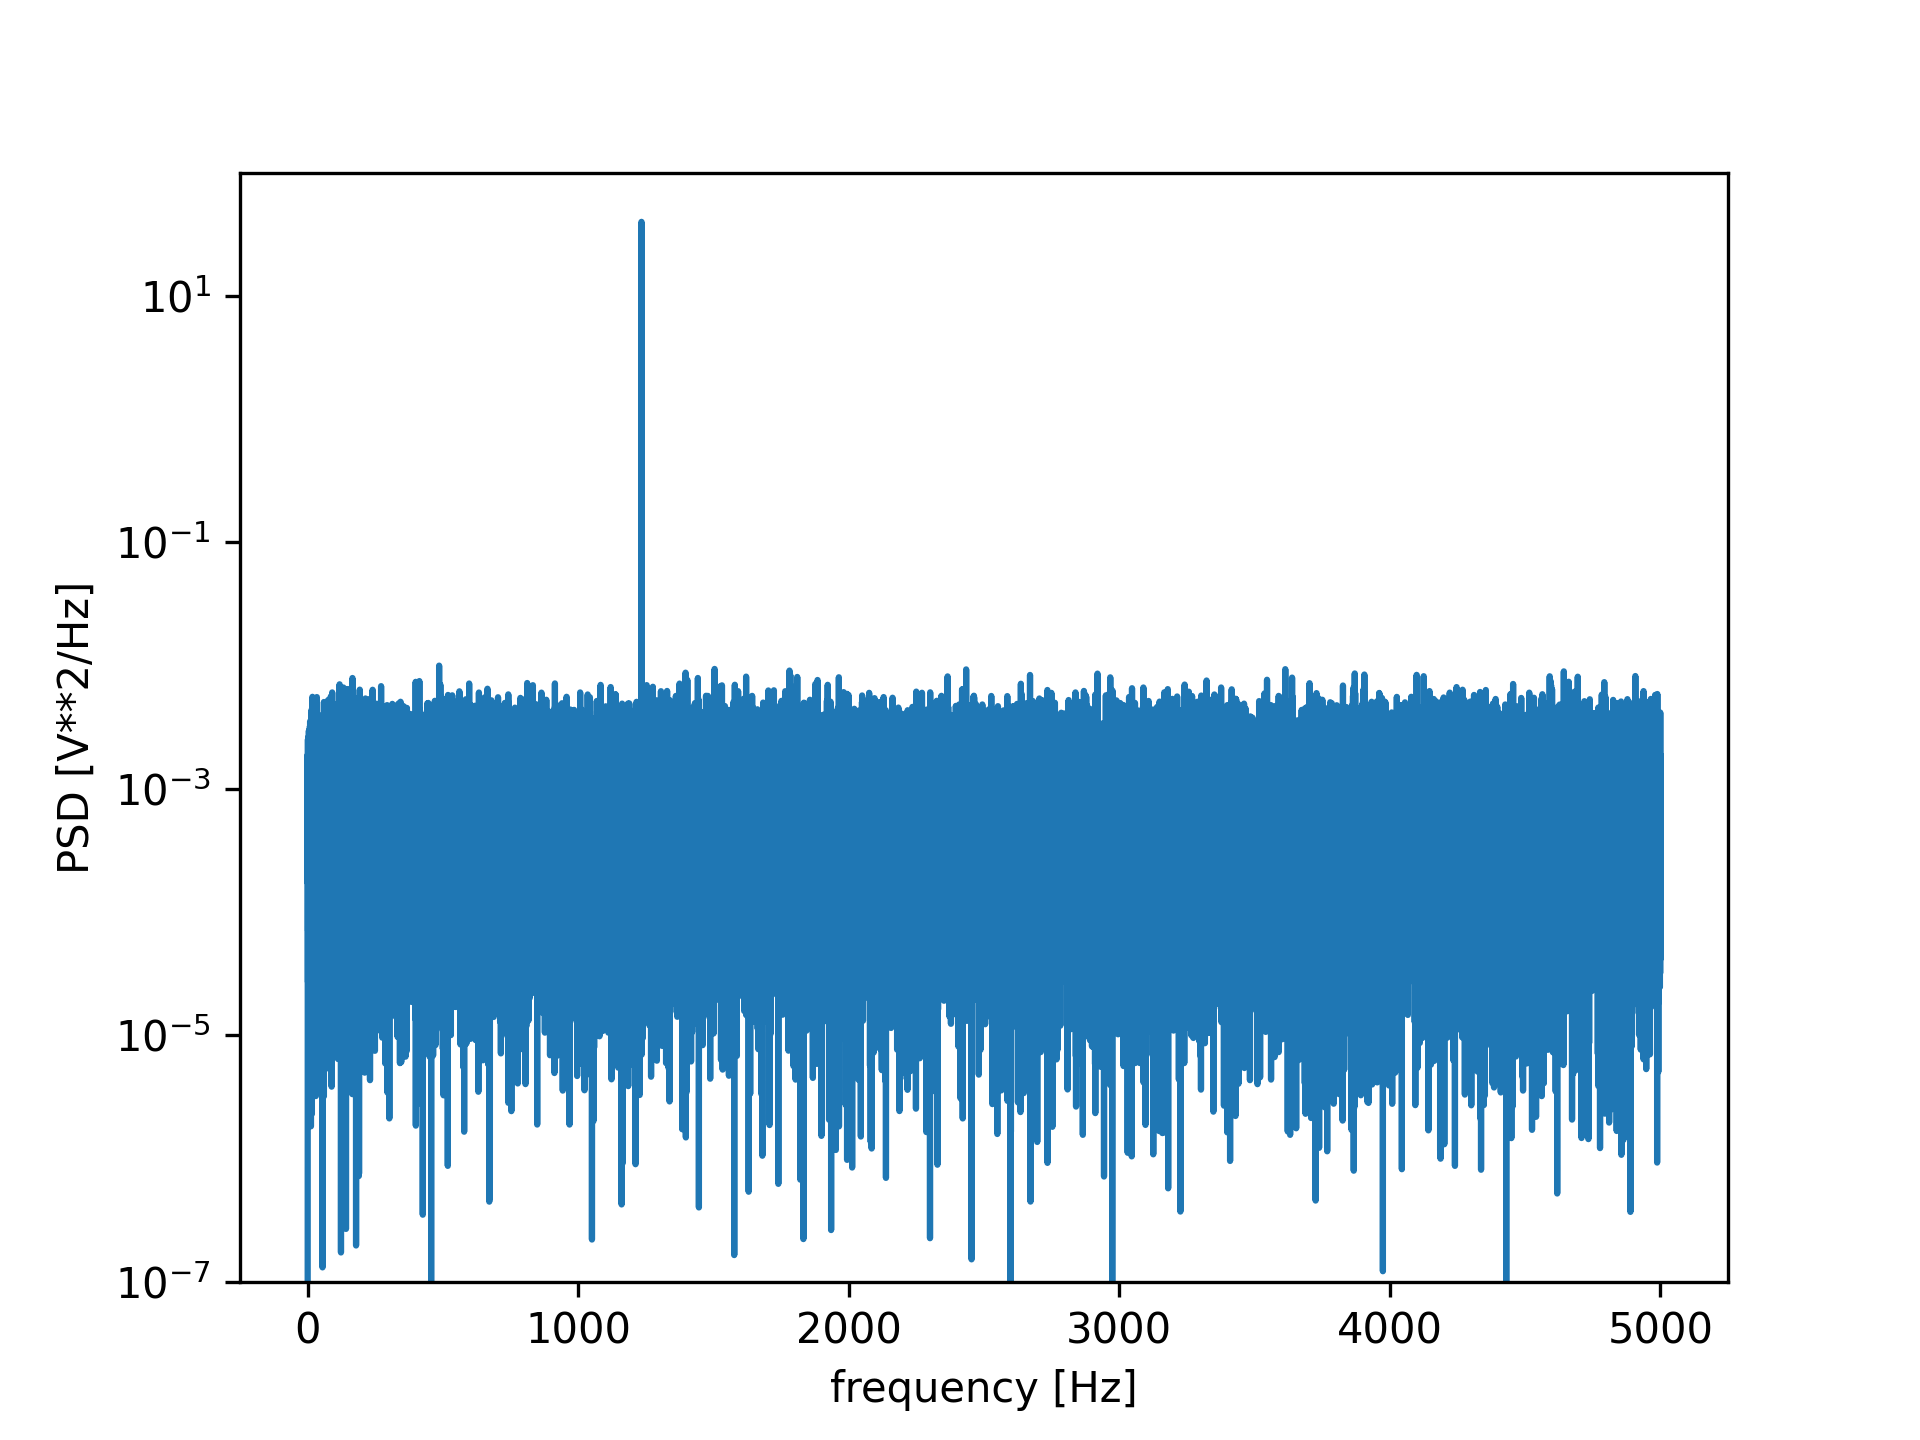
np.mean(Pxx_den[25000:])
✗f, Pxx_spec = signal.periodogram(x, fs, 'flattop', scaling='spectrum')
✓plt.figure() plt.semilogy(f, np.sqrt(Pxx_spec)) plt.ylim([1e-4, 1e1]) plt.xlabel('frequency [Hz]') plt.ylabel('Linear spectrum [V RMS]')✗
plt.show()
✓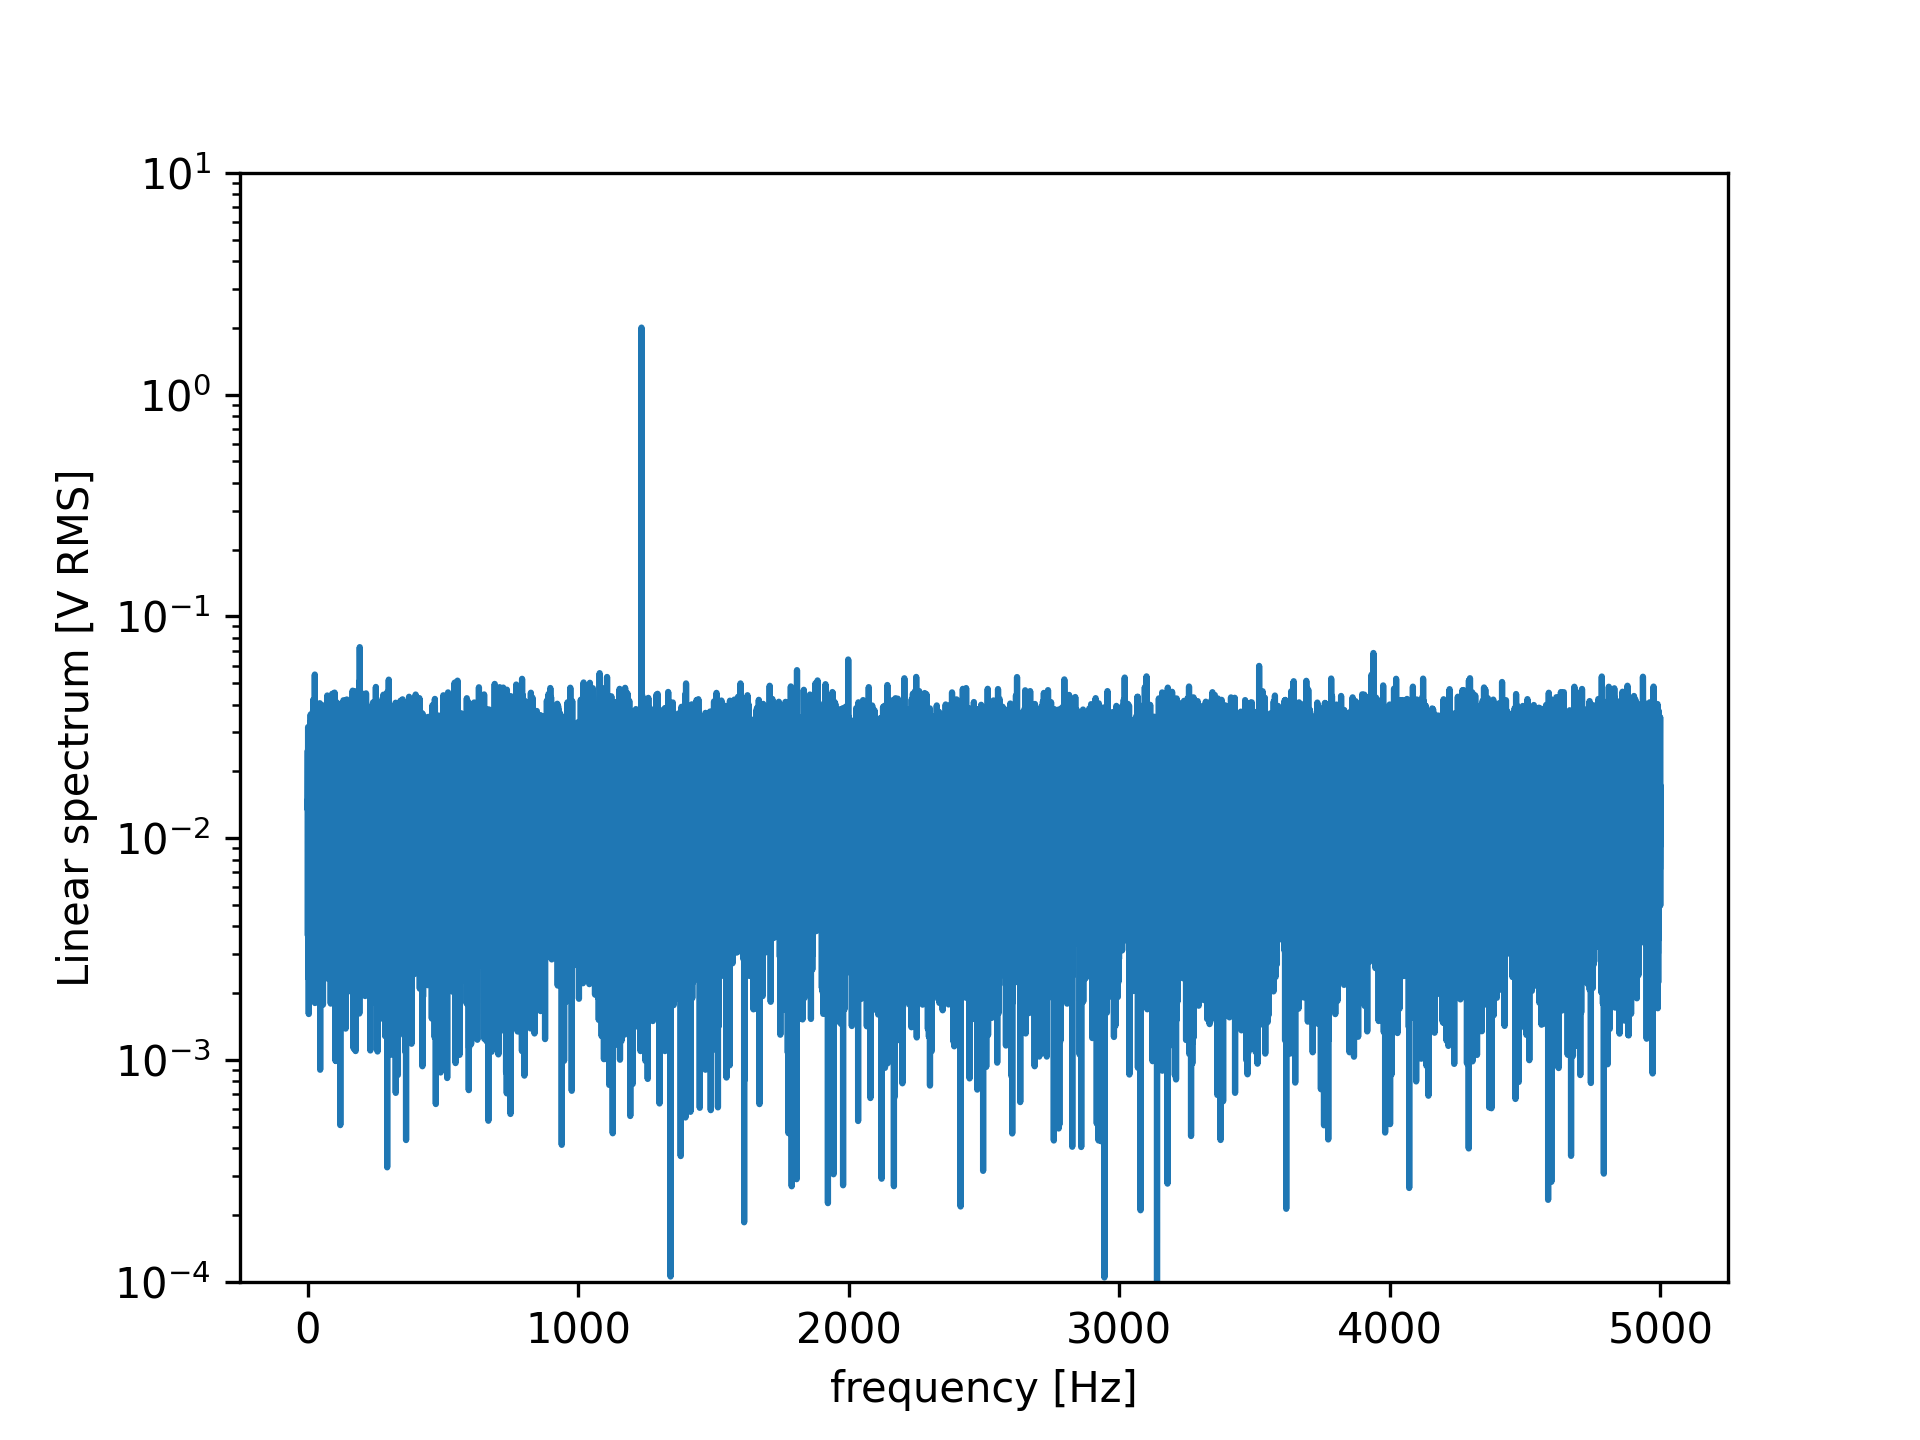
np.sqrt(Pxx_spec.max())
✗See also
- lombscargle
Lomb-Scargle periodogram for unevenly sampled data
- welch
Estimate power spectral density using Welch's method
Aliases
-
scipy.signal.periodogram