bundles / scipy 1.17.1 / scipy / signal / _waveforms / unit_impulse
function
scipy.signal._waveforms:unit_impulse
source: /scipy/signal/_waveforms.py :584
Signature
def unit_impulse ( shape , idx = None , dtype = <class 'float'> ) Summary
Unit impulse signal (discrete delta function) or unit basis vector.
Parameters
shape: int or tuple of intNumber of samples in the output (1-D), or a tuple that represents the shape of the output (N-D).
idx: None or int or tuple of int or 'mid', optionalIndex at which the value is 1. If None, defaults to the 0th element. If
idx='mid', the impulse will be centered atshape // 2in all dimensions. If an int, the impulse will be atidxin all dimensions.dtype: data-type, optionalThe desired data-type for the array, e.g.,
numpy.int8. Default isnumpy.float64.
Returns
y: ndarrayOutput array containing an impulse signal.
Notes
In digital signal processing literature the unit impulse signal is often represented by the Kronecker delta. [1] I.e., a signal , which is zero everywhere except being one at the -th sample, can be expressed as
Furthermore, the unit impulse is frequently interpreted as the discrete-time version of the continuous-time Dirac distribution. [2]
Array API Standard Support
unit_impulse has experimental support for Python Array API Standard compatible backends in addition to NumPy. Please consider testing these features by setting an environment variable SCIPY_ARRAY_API=1 and providing CuPy, PyTorch, JAX, or Dask arrays as array arguments. The following combinations of backend and device (or other capability) are supported.
====================  ====================  ====================
Library               CPU                   GPU
====================  ====================  ====================
NumPy                 ✅                     n/a
CuPy                  n/a                   ⛔
PyTorch               ⛔                     ⛔
JAX                   ⛔                     ⛔
Dask                  ⛔                     n/a
====================  ====================  ====================
See
dev-arrayapifor more information.
Examples
An impulse at the 0th element (:math:`\\delta[n]`):from scipy import signal
✓signal.unit_impulse(8)
✗signal.unit_impulse(7, 2)
✗signal.unit_impulse((3, 3), 'mid')
✗signal.unit_impulse((4, 4), 2)
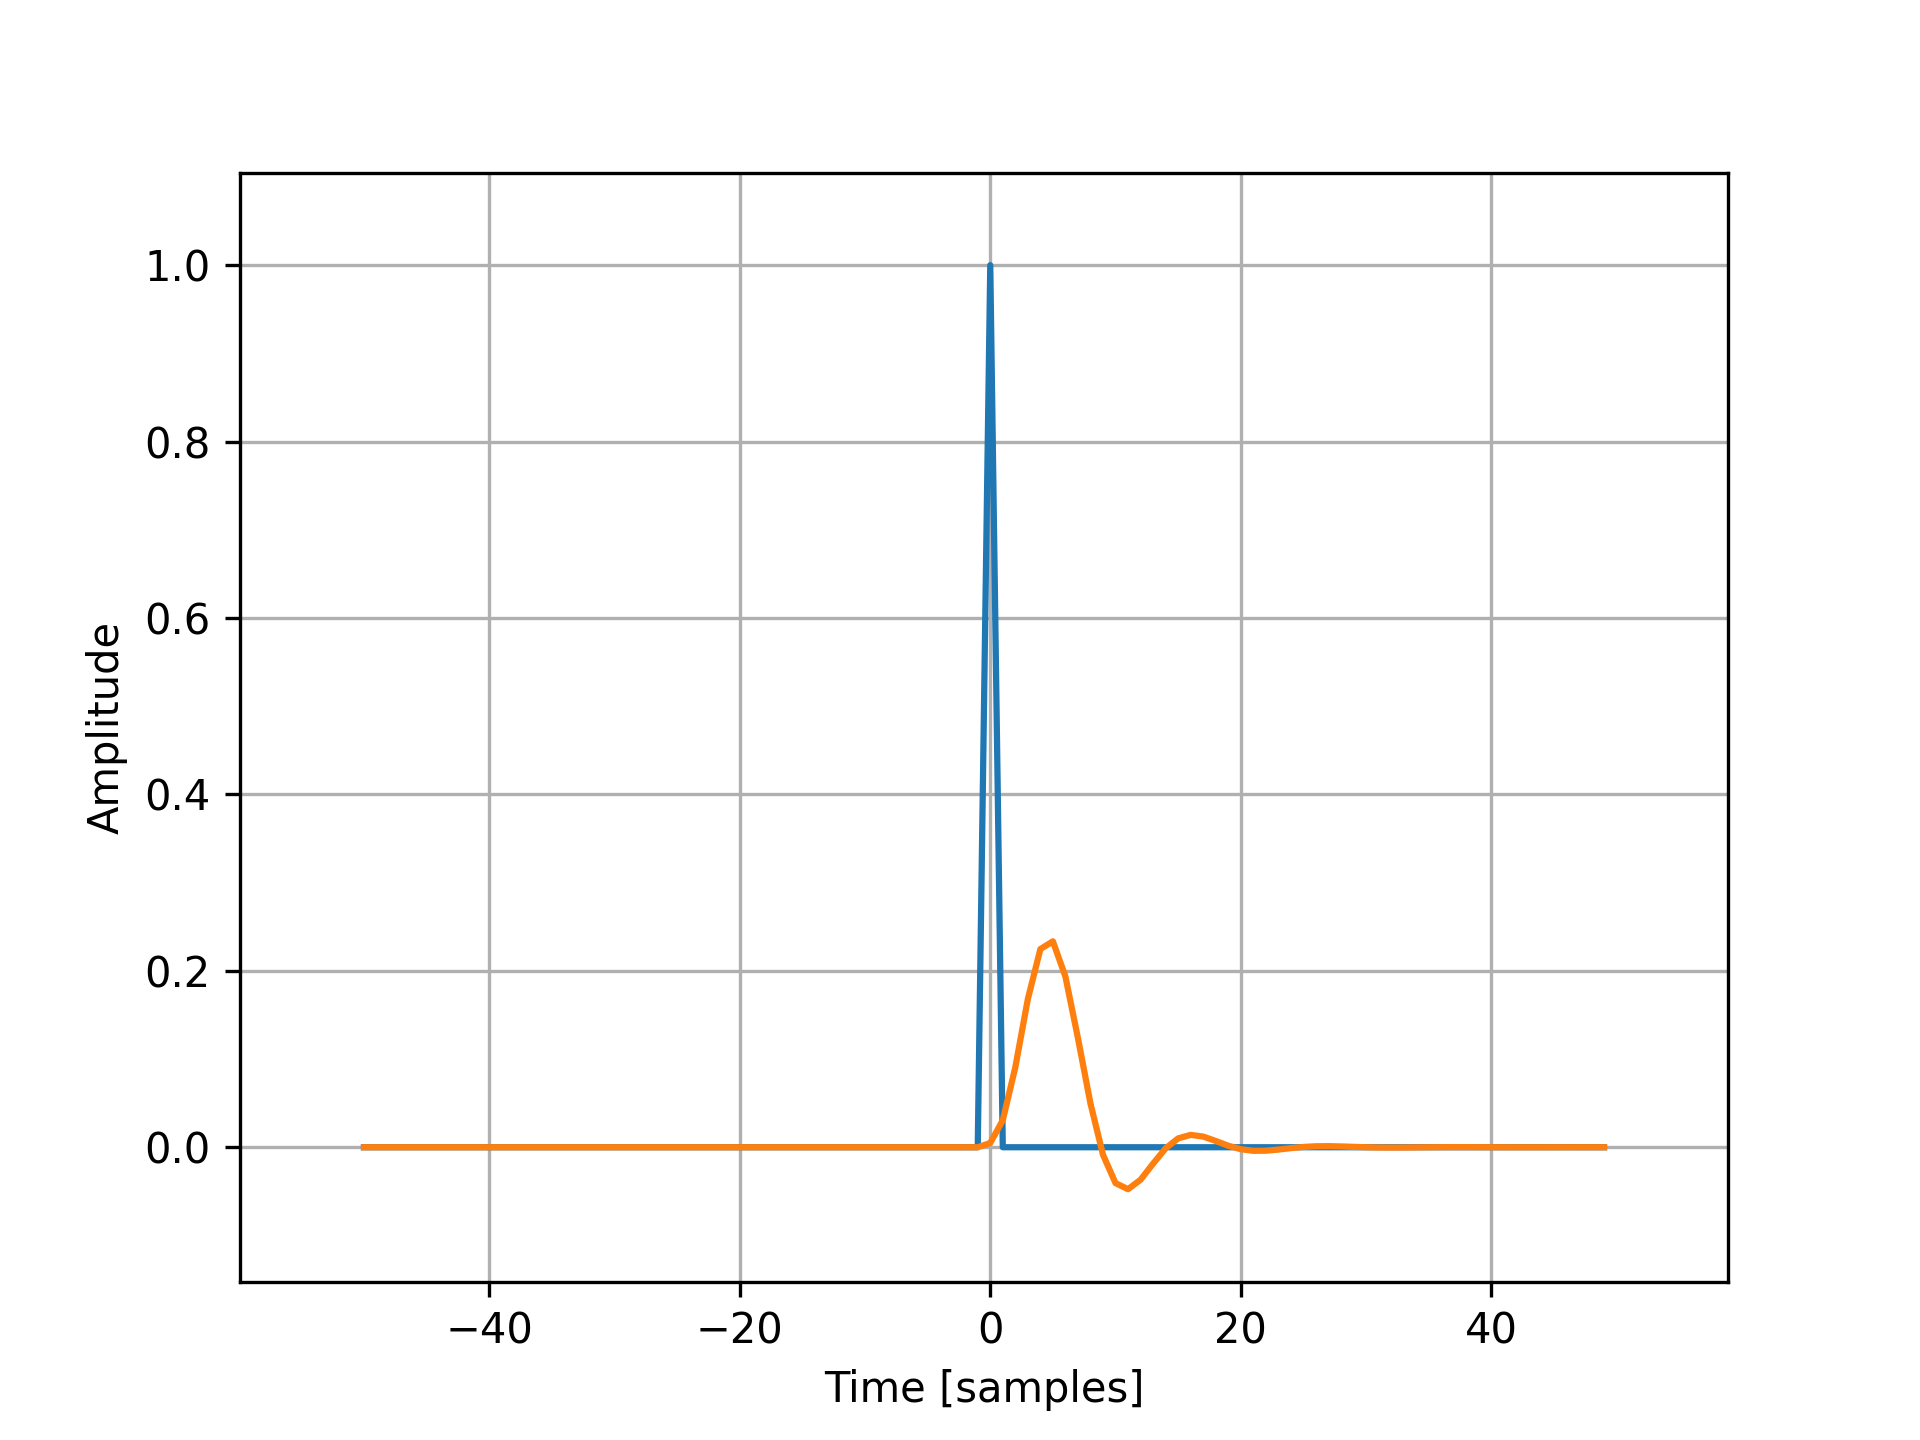
✗imp = signal.unit_impulse(100, 'mid') b, a = signal.butter(4, 0.2) response = signal.lfilter(b, a, imp)✓
import numpy as np
import matplotlib.pyplot as plt
✓
plt.plot(np.arange(-50, 50), imp)
plt.plot(np.arange(-50, 50), response)
✗
plt.margins(0.1, 0.1)
✓plt.xlabel('Time [samples]') plt.ylabel('Amplitude')✗
plt.grid(True)
plt.show()
✓
Aliases
-
scipy.signal.unit_impulse