bundles / scipy 1.18.0 / scipy / stats / _continuous_distns / levy_l_gen
class
scipy.stats._continuous_distns:levy_l_gen
Signature
class levy_l_gen(momtype = 1, a = None, b = None, xtol = 1e-14, badvalue = None, name = None, longname = None, shapes = None, seed = None)Members
Summary
A left-skewed Levy continuous random variable.
Extended Summary
%(before_notes)s
Notes
The probability density function for levy_l is:
for .
This is the same as the Levy-stable distribution with and .
%(after_notes)s
Examples
import numpy as np
from scipy.stats import levy_l
import matplotlib.pyplot as plt
fig, ax = plt.subplots(1, 1)
✓
mean, var, skew, kurt = levy_l.stats(moments='mvsk')
✓a, b = levy_l.ppf(0.4), levy_l.ppf(1) x = np.linspace(a, b, 100)✓
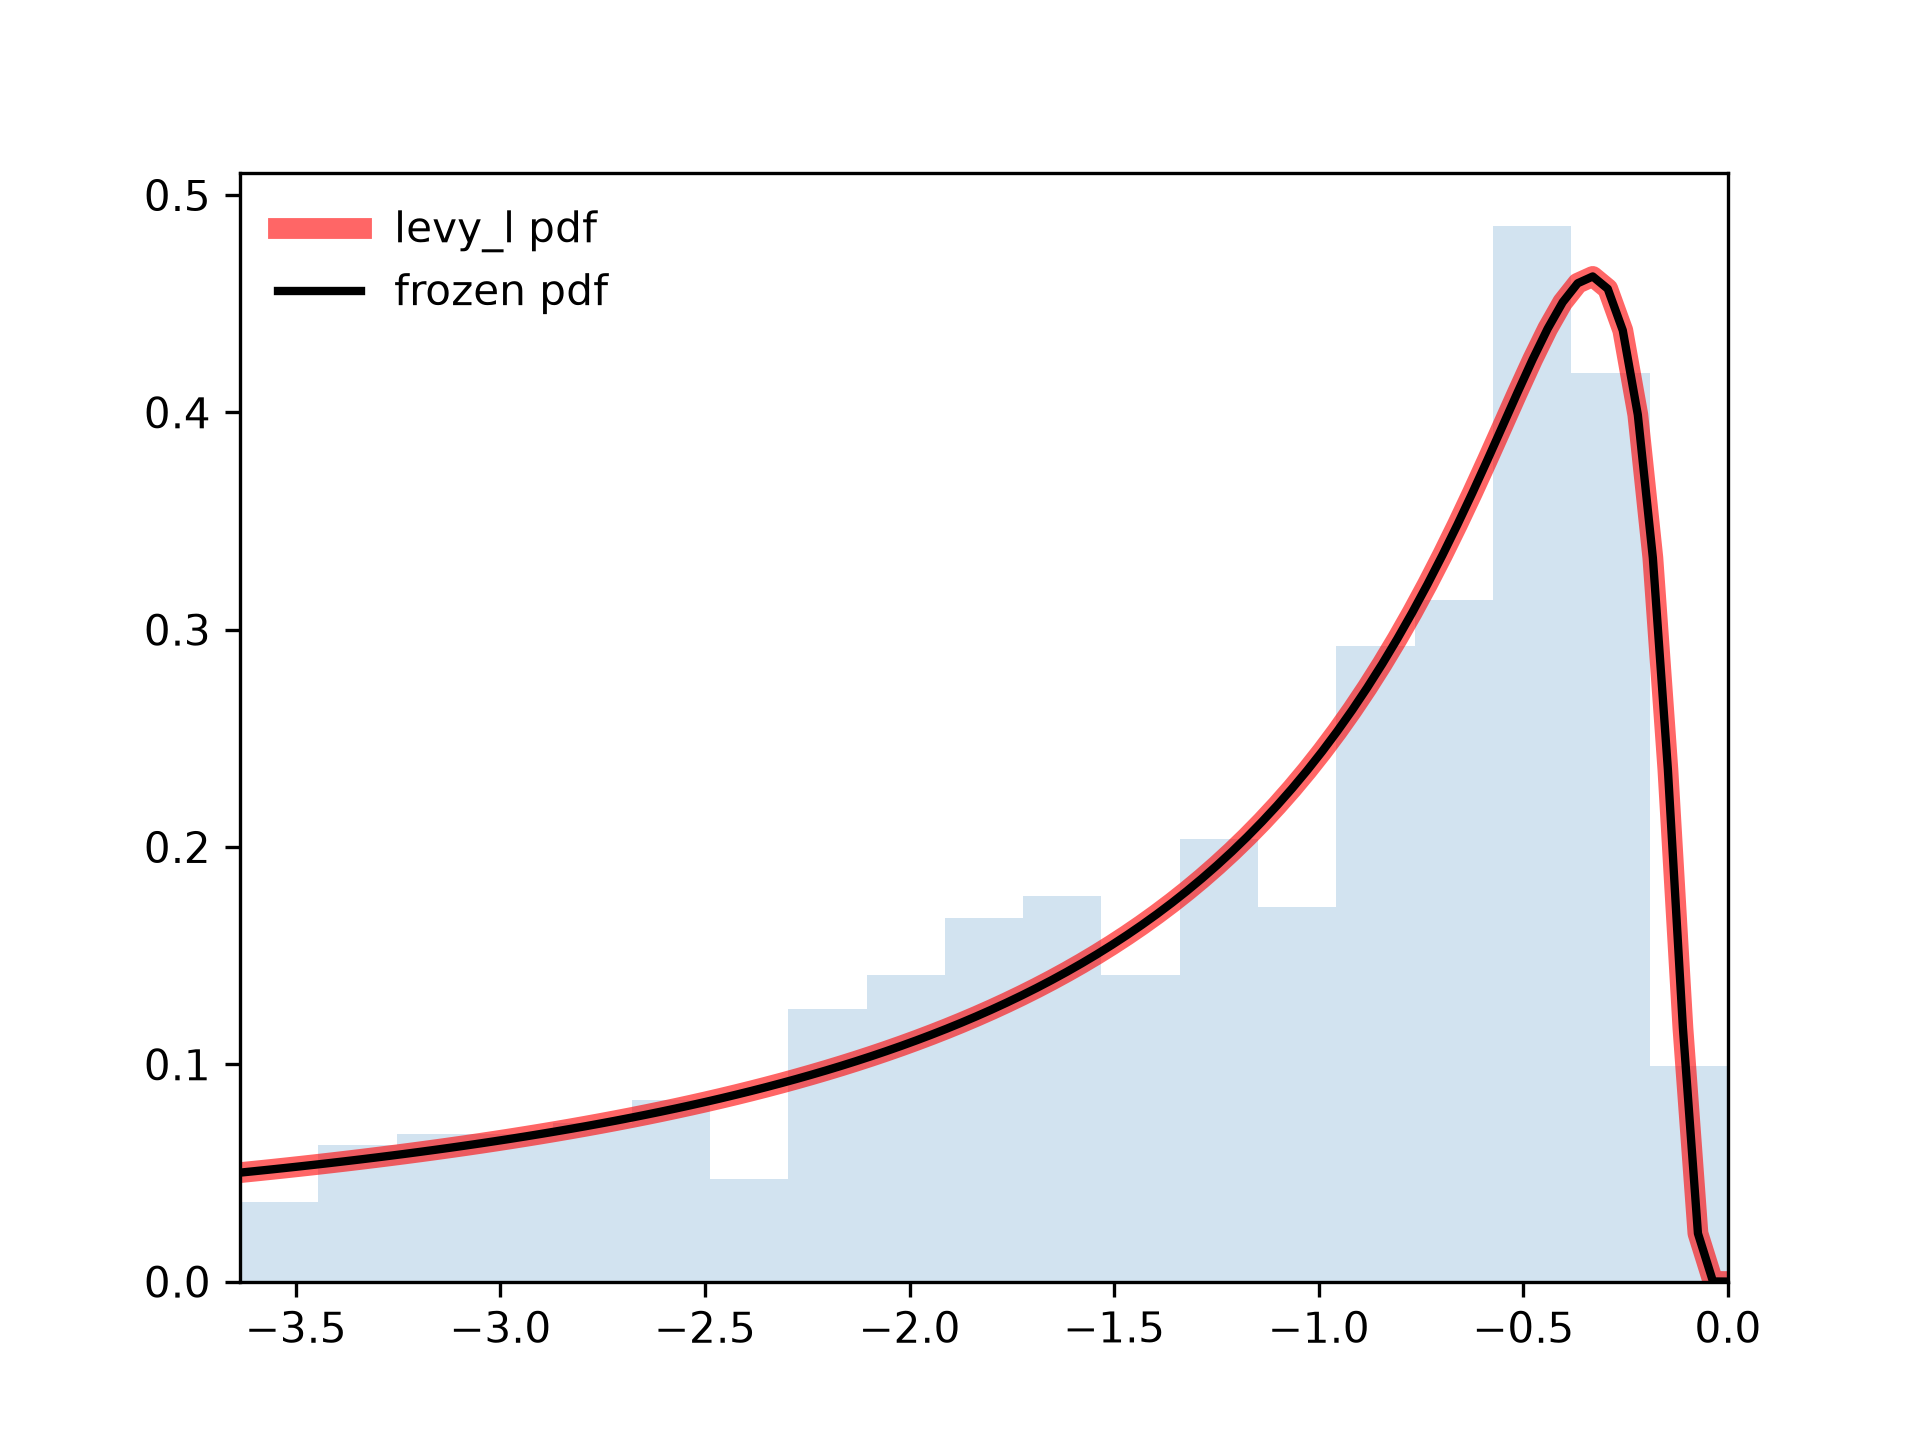
ax.plot(x, levy_l.pdf(x),
       'r-', lw=5, alpha=0.6, label='levy_l pdf')
✗
[<matplotlib.lines.Line2D object at 0x7fa8f406f4d0>]Alternatively, the distribution object can be called (as a function) to fix the shape, location and scale parameters. This returns a "frozen" RV object holding the given parameters fixed. Freeze the distribution and display the frozen ``pdf``:
rv = levy_l()
✓ax.plot(x, rv.pdf(x), 'k-', lw=2, label='frozen pdf')
✗[<matplotlib.lines.Line2D object at 0x7fa8f406da90>]Check accuracy of ``cdf`` and ``ppf``:
vals = levy_l.ppf([0.001, 0.5, 0.999])
np.allclose([0.001, 0.5, 0.999], levy_l.cdf(vals))
✓
TrueGenerate random numbers:
r = levy_l.rvs(size=1000)
✓bins = np.concatenate(([np.min(r)], np.linspace(a, b, 20)))
✓ax.hist(r, bins=bins, density=True, histtype='stepfilled', alpha=0.2) ax.set_xlim([x[0], x[-1]]) ax.legend(loc='best', frameon=False)✗
<matplotlib.legend.Legend object at 0x7fa8e43b8980>
plt.show()
✓
See also
- levy
- levy_stable
Aliases
scipy.stats._continuous_distns.levy_l_gen