bundles / scipy 1.18.0 / scipy / stats / _continuous_distns / studentized_range_gen
class
scipy.stats._continuous_distns:studentized_range_gen
Signature
class studentized_range_gen(momtype = 1, a = None, b = None, xtol = 1e-14, badvalue = None, name = None, longname = None, shapes = None, seed = None)Members
Summary
A studentized range continuous random variable.
Extended Summary
%(before_notes)s
Notes
The probability density function for studentized_range is:
for , , and .
studentized_range takes k for and df for as shape parameters.
When exceeds 100,000, an asymptotic approximation (infinite degrees of freedom) is used to compute the cumulative distribution function [4] and probability distribution function.
%(after_notes)s
Examples
import numpy as np
from scipy.stats import studentized_range
import matplotlib.pyplot as plt
fig, ax = plt.subplots(1, 1)
✓
k, df = 3, 10
x = np.linspace(studentized_range.ppf(0.01, k, df),
                studentized_range.ppf(0.99, k, df), 100)
✓
ax.plot(x, studentized_range.pdf(x, k, df),
        'r-', lw=5, alpha=0.6, label='studentized_range pdf')
✗
[<matplotlib.lines.Line2D object at 0x7fa8fc426a50>]Alternatively, the distribution object can be called (as a function) to fix the shape, location and scale parameters. This returns a "frozen" RV object holding the given parameters fixed. Freeze the distribution and display the frozen ``pdf``:
rv = studentized_range(k, df)
✓ax.plot(x, rv.pdf(x), 'k-', lw=2, label='frozen pdf')
✗[<matplotlib.lines.Line2D object at 0x7fa8fc424440>]Check accuracy of ``cdf`` and ``ppf``:
vals = studentized_range.ppf([0.001, 0.5, 0.999], k, df)
np.allclose([0.001, 0.5, 0.999], studentized_range.cdf(vals, k, df))
✓
TrueRather than using (``studentized_range.rvs``) to generate random variates, which is very slow for this distribution, we can approximate the inverse CDF using an interpolator, and then perform inverse transform sampling with this approximate inverse CDF. This distribution has an infinite but thin right tail, so we focus our attention on the leftmost 99.9 percent.
a, b = studentized_range.ppf([0, .999], k, df)
✓a, b
✗(np.float64(0.0), np.float64(7.41058083802341))
from scipy.interpolate import interp1d
rng = np.random.default_rng()
xs = np.linspace(a, b, 50)
✓
cdf = studentized_range.cdf(xs, k, df)
ppf = interp1d(cdf, xs, fill_value='extrapolate')
✗
r = ppf(rng.uniform(size=1000))
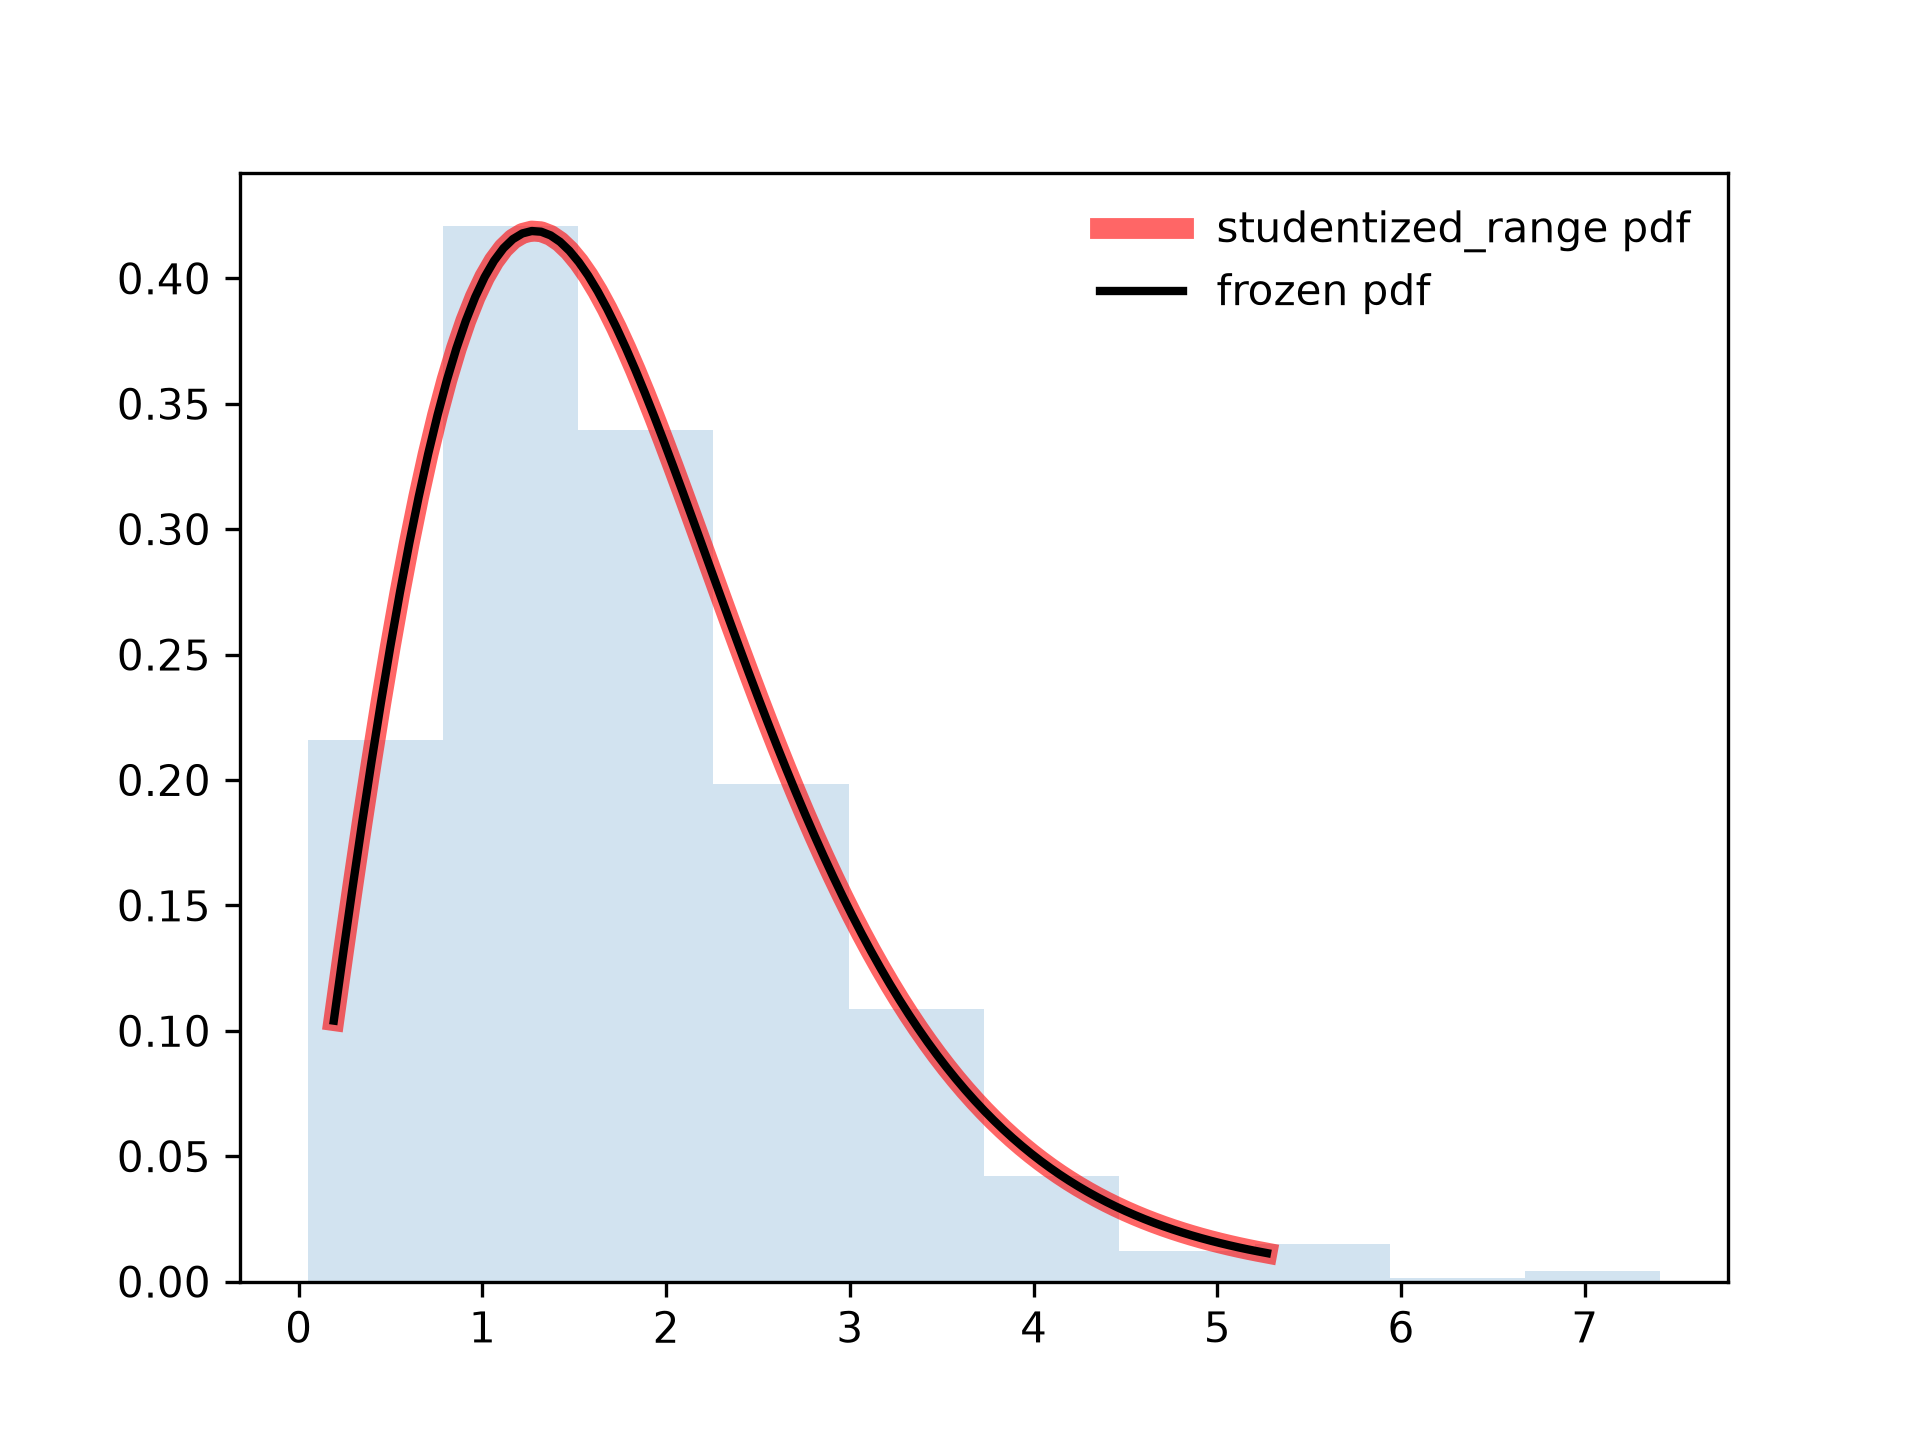
✓ax.hist(r, density=True, histtype='stepfilled', alpha=0.2) ax.legend(loc='best', frameon=False)✗
<matplotlib.legend.Legend object at 0x7fa8fc4263c0>
plt.show()
✓
See also
- t
Student's t distribution
Aliases
scipy.stats._continuous_distns.studentized_range_gen