bundles / scipy latest / scipy / spatial / _plotutils / delaunay_plot_2d
function
scipy.spatial._plotutils:delaunay_plot_2d
source: build-install/usr/lib/python3.14/site-packages/scipy/spatial/_plotutils.py:22
Signature
def delaunay_plot_2d(tri, ax = None)Summary
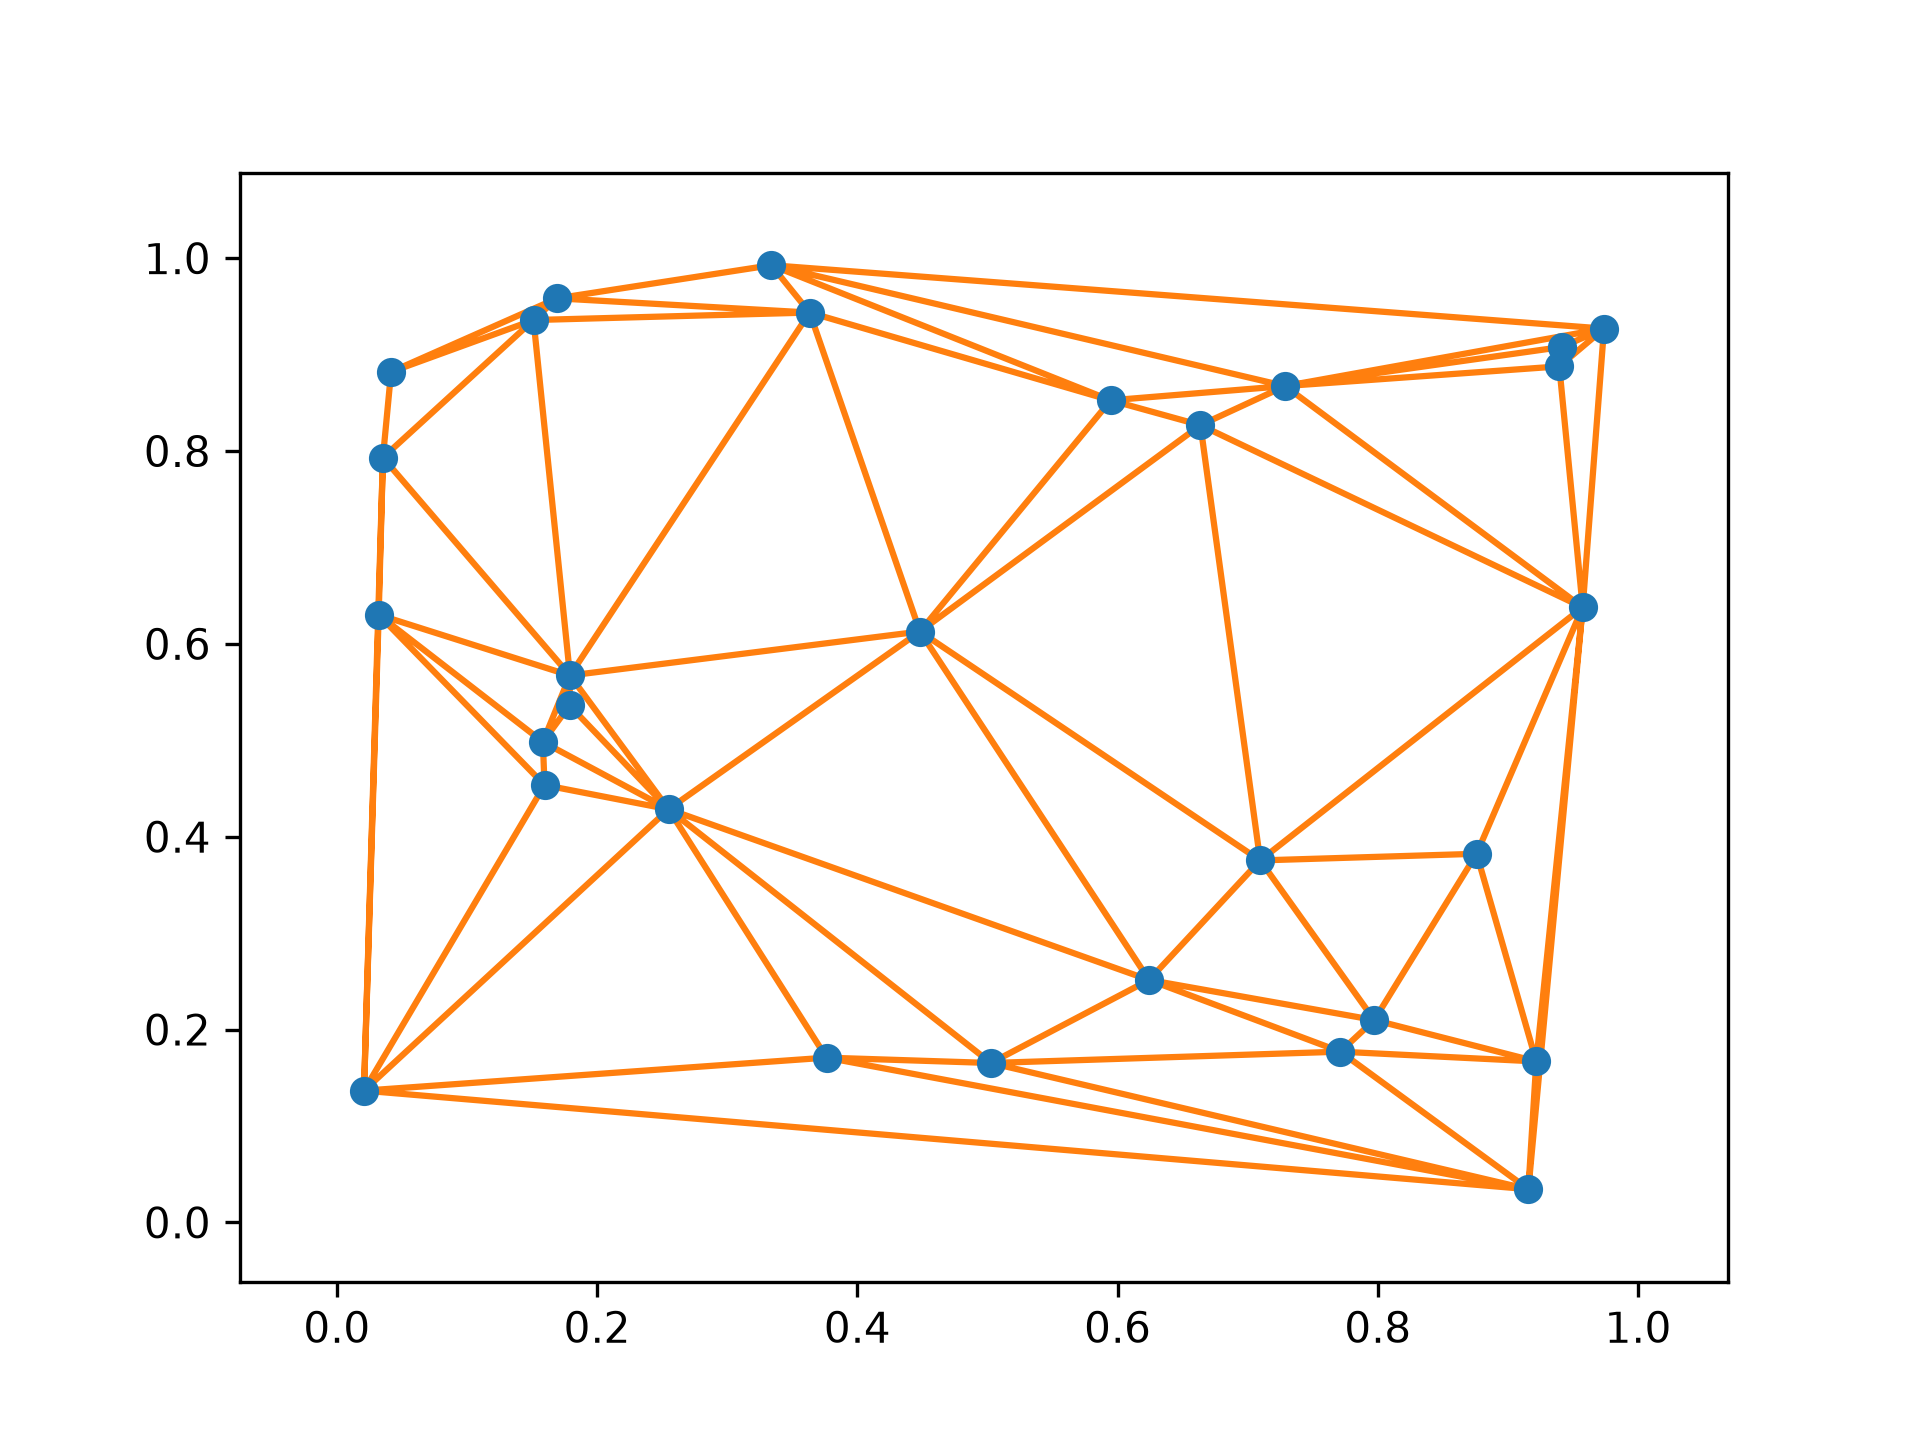
Plot the given Delaunay triangulation in 2-D.
Parameters
tri: scipy.spatial.Delaunay instanceTriangulation to plot
ax: matplotlib.axes.Axes instance, optionalAxes to plot on
Returns
fig: matplotlib.figure.Figure instanceFigure for the plot
Notes
Requires Matplotlib.
Array API Standard Support
delaunay_plot_2d is not in-scope for support of Python Array API Standard compatible backends other than NumPy.
See dev-arrayapi for more information.
Examples
import numpy as np
import matplotlib.pyplot as plt
from scipy.spatial import Delaunay, delaunay_plot_2d
✓
rng = np.random.default_rng()
points = rng.random((30, 2))
tri = Delaunay(points)
✓
_ = delaunay_plot_2d(tri)
plt.show()
✓
See also
- Delaunay
- matplotlib.pyplot.triplot
Aliases
scipy.spatial.delaunay_plot_2d